I. Introduction to Health Technology Assessment
This section provides an overview of health technology assessment (HTA), its origins, and its evolving role in health care.
- A. Origins of Technology Assessment
- B. Early Health Care Technology Assessment
- References for Chapter I
Technological innovation has yielded truly remarkable advances in health care during the last five decades. In recent years, breakthroughs in a variety of areas have helped to improve health care delivery and patient outcomes, including antivirals, anticlotting drugs, antidiabetic drugs, antihypertensive drugs, antirheumatic drugs, vaccines, pharmacogenomics and targeted cancer therapies, cardiac rhythm management, diagnostic imaging, minimally invasive surgery, joint replacement, pain management, infection control, and health information technology.
The proliferation of health care technology and its expanding uses have contributed to burgeoning health care costs, and the former has been cited as “culprit” for the latter. However, this relationship is variable, complex, and evolving (Cutler 2001; Cutler 2011; Goyen 2009; Medicare Payment Advisory Commission 2001; Newhouse 1992; Smith 2000). In the US, the Congressional Budget Office concluded that “roughly half of the increase in health care spending during the past several decades was associated with the expanded capabilities of medicine brought about by technological advances” (US Congressional Budget Office 2008).
Few patients or clinicians are willing to forego access to state-of-the-art health care technology. In the wealthier countries and those with growing economies, adoption and use of technology has been stimulated by patient and physician incentives to seek any potential health benefit with limited regard to cost, and by third-party payment, provider competition, effective marketing of technologies, and consumer awareness. Box I-1 shows some of the factors that influence demand for health technology.
Box I-1. Factors That Reinforce the Market for Health Technology
- Advances in science and engineering
- Intellectual property, especially patent protection
- Aging populations
- Increasing prevalence of chronic diseases
- Emerging pathogens and other disease threats
- Third-party payment, especially fee-for-service payment
- Financial incentives of technology companies, clinicians, hospitals, and others
- Public demand driven by direct-to-consumer advertising, mass media reports, social media, and consumer awareness and advocacy
- Off-label use of drugs, biologics, and devices
- “Cascade” effects of unnecessary tests, unexpected results, or patient or physician anxiety
- Clinician specialty training at academic medical centers
- Provider competition to offer state-of-the-art technology
- Malpractice avoidance
- Strong or growing economies
In this era of increasing cost pressures, restructuring of health care delivery and payment, and heightened consumer demand—yet continued inadequate access to care for many millions of people—technology remains the substance of health care. Culprit or not, technology can be managed in ways that improve patient access and health outcomes, while continuing to encourage useful innovation. The development, adoption, and diffusion of technology are increasingly influenced by a widening group of policymakers in the health care sector. Health product makers, regulators, clinicians, patients, hospital managers, payers, government leaders, and others increasingly demand well-founded information to support decisions about whether or how to develop technology, to allow it on the market, to acquire it, to use it, to pay for its use, to ensure its appropriate use, and more. The growth and development of health technology assessment (HTA) in government and the private sector reflect this demand.
HTA methods are evolving and their applications are increasingly diverse. This document introduces fundamental aspects and issues of a dynamic field of inquiry. Broader participation of people with multiple disciplines and different roles in health care is enriching the field. The heightened demand for HTA, in particular from the for-profit and not-for-profit private sectors as well as from government agencies, is pushing the field to evolve more systematic and transparent assessment processes and reporting to diverse users. The body of knowledge about HTA cannot be found in one place and is not static. Practitioners and users of HTA should not only monitor changes in the field, but have considerable opportunities to contribute to its development.
A. Origins of Technology Assessment
Technology assessment (TA) arose in the mid-1960s from an appreciation of the critical role of technology in modern society and its potential for unintended, and sometimes harmful, consequences. Experience with the side effects of a multitude of chemical, industrial and agricultural processes and such services as transportation, health, and resource management contributed to this understanding. Early assessments concerned such topics as offshore oil drilling, pesticides, automobile pollution, nuclear power plants, supersonic airplanes, weather modification, and the artificial heart. TA was conceived as a way to identify the desirable first-order, intended effects of technologies as well as the higher-order, unintended social, economic and environmental effects (Banta 2009; Brooks and Bowers 1970; Kunkle 1995; Margolis 2003).
The term “technology assessment” was introduced in 1965 during deliberations of the Committee on Science and Astronautics of the US House of Representatives. Congressman Emilio Daddario emphasized that the purpose of TA was to serve policymaking:
[T]echnical information needed by policymakers is frequently not available, or not in the right form. A policymaker cannot judge the merits or consequences of a technological program within a strictly technical context. He has to consider social, economic, and legal implications of any course of action (US Congress, House of Representatives 1967).
Congress commissioned independent studies by the National Academy of Sciences, the National Academy of Engineering (NAE), and the Legislative Reference Service of the Library of Congress that significantly influenced the development and application of TA. These studies and further congressional hearings led the National Science Foundation to establish a TA program and, in 1972, Congress to authorize the congressional Office of Technology Assessment (OTA), which was founded in 1973, became operational in 1974, and established its health program in 1975.
Many observers were concerned that TA would be a means by which government would impede the development and use of technology. However, this was not the intent of Congress or of the agencies that conducted the original TAs. In 1969, an NAE report to Congress emphasized that:
Technology assessment would aid the Congress to become more effective in assuring that broad public as well as private interests are fully considered while enabling technology to make the maximum contribution to our society's welfare (National Academy of Engineering 1969).
With somewhat different aims, private industry used TA to aid in competing in the marketplace, for understanding the future business environment, and for producing options for decision makers.
TA methodology drew upon a variety of analytical, evaluative, and planning techniques. Among these were systems analysis, cost-benefit analysis, consensus development methods (e.g., Delphi method), engineering feasibility studies, clinical trials, market research, technological forecasting, and others. TA practitioners and policymakers recognized that TA is evolving, flexible, and should be tailored to the task (US Congress, Office of Technology Assessment 1977). Box I-2 shows various definitions of TA.
Box I-2. Some Definitions of Technology Assessment
[Technology assessment is] the systematic study of the effects on society, that may occur when a technology is introduced, extended, or modified, with emphasis on the impacts that are unintended, indirect, or delayed (Coates 1976).
Technology assessment (TA) is a category of policy studies, intended to provide decision makers with information about the possible impacts and consequences of a new technology or a significant change in an old technology. It is concerned with both direct and indirect or secondary consequences, both benefits and disbenefits, and with mapping the uncertainties involved in any government or private use or transfer of a technology. TA provides decision makers with an ordered set of analyzed policy options, and an understanding of their implications for the economy, the environment, and the social, political, and legal processes and institutions of society (Coates 1992).
Technology assessment ultimately comprises a systems approach to the management of technology reaching beyond technology and industrial aspects into society and environmental domains. Initially, it deals with assessment of effects, consequences, and risks of a technology, but also is a forecasting function looking into the projection of opportunities and skill development as an input into strategic planning. In this respect, it also has a component both for monitoring and scrutinizing information gathering. Ultimately, TA is a policy and consensus building process as well (UN Branch for Science and Technology for Development 1991).
Technology assessment is a form of policy research that examines short- and long-term social consequences (for example, societal, economic, ethical, legal) of the application of technology. The goal of technology assessment is to provide policy-makers with information on policy alternatives (Banta 1993).
Technology Assessment is a concept, which embraces different forms of policy analysis on the relation between science and technology on the one hand, and policy, society and the individual on the other hand. Technology Assessment typically includes policy analysis approaches such as foresight; economic analysis; systems analysis; strategic analysis etc. … Technology Assessment has three dimensions: the cognitive dimension ─ creating overview on knowledge, relevant to policy-making; the normative dimension ─ establishing dialogue in order to support opinion making; the pragmatic dimension ─ establish processes that help decisions to be made. And TA has three objects: the issue or technology; the social aspects; the policy aspects (European Parliamentary Technology Assessment 2013).
B. Early Health Technology Assessment
Health technologies had been studied for safety, effectiveness, cost, and other concerns long before the advent of HTA. Development of TA as a systematic inquiry in the 1960s and 1970s coincided with the introduction of some health technologies that prompted widespread public interest in matters that transcended their immediate health effects. Health care technologies were among the topics of early TAs. Multiphasic health screening was one of three topics of “experimental” TAs conducted by the NAE at the request of Congress (National Academy of Engineering 1969). In response to a request by the National Science Foundation to further develop the TA concept in the area of biomedical technologies, the National Research Council conducted TAs on in vitro fertilization, predetermination of the sex of children, retardation of aging, and modifying human behavior by neurosurgical, electrical or pharmaceutical means (National Research Council 1975). The OTA issued a report on drug bioequivalence in 1974 (Drug Bioequivalence 1974), and the OTA Health Program issued its first formal report in 1976.
Since its early years, HTA has been fueled in part by emergence and diffusion of technologies that have evoked social, ethical, legal, and political concerns. Among these technologies are contraceptives, organ transplantation, artificial organs, life-sustaining technologies for critically or terminally ill patients, and, more recently, genetic testing, genetic therapy, ultrasonography for fetal sex selection, and stem cell research. These technologies have challenged certain societal institutions, codes, and other norms regarding fundamental aspects of human life such as parenthood, heredity, birth, bodily sovereignty, freedom and control of human behavior, and death (National Research Council 1975).
Despite the comprehensive approach originally intended for TA, its practitioners recognized early on that “partial TAs” may be preferable in circumstances where selected impacts are of particular interest or where necessitated by resource constraints (US Congress, Office of Technology Assessment 1977). In practice, relatively few TAs have encompassed the full range of possible technological impacts; most focus on certain sets of impacts or concerns. Indeed, the scope of HTA reports has been diversified in recent years by the use of “horizon scanning” and the demand for “rapid HTAs,” which are described later in this document.
Box I-3. Some Definitions of Health Technology Assessment
We shall use the term assessment of a medical technology to denote any process of examining and reporting properties of a medical technology used in health care, such as safety, efficacy, feasibility, and indications for use, cost, and cost-effectiveness, as well as social, economic, and ethical consequences, whether intended or unintended (Institute of Medicine 1985).
Health technology assessment ... is a structured analysis of a health technology, a set of related technologies, or a technology-related issue that is performed for the purpose of providing input to a policy decision (US Congress, Office of Technology Assessment 1994).
Health Technology Assessment asks important questions about these technologies [drugs, devices, procedures, settings of care, screening] such as: When is counselling better than drug treatment for depression? What is the best operation for aortic aneurysms? Should we screen for human papilloma virus when doing cervical smears? Should aspirin be used for the primary prevention of cardiovascular disease? It answers these questions by investigating four main factors: whether the technology works, for whom, at what cost, how it compares with the alternatives (UK NHS National Institute for Health Research Health Technology Assessment Programme 2013).
HTA is a field of scientific research to inform policy and clinical decision making around the introduction and diffusion of health technologies…. HTA is a multidisciplinary field that addresses the health impacts of technology, considering its specific healthcare context as well as available alternatives. Contextual factors addressed by HTA include economic, organizational, social, and ethical impacts. The scope and methods of HTA may be adapted to respond to the policy needs of a particular health system (Health Technology Assessment International 2013).
Health technology assessment (HTA) is a multidisciplinary process that summarises information about the medical, social, economic and ethical issues related to the use of a health technology in a systematic, transparent, unbiased, robust manner. Its aim is to inform the formulation of safe, effective, health policies that are patient focused and seek to achieve best value. Despite its policy goals, HTA must always be firmly rooted in research and the scientific method (European Network for Health Technology Assessment 2013).
References for Chapter I
Banta D. What is technology assessment? Int J Technol Assess Health Care. 2009;25 Suppl 1:7-9. Pubmed | Publisher free article
Banta HD, Luce BR. Health Care Technology and Its Assessment: An International Perspective. New York, NY: Oxford University Press; 1993.
Brooks H, Bowers R. The assessment of technology. Sci Am. 1970;222(2):13-20. TRB Database Abstract
Coates JF. 1976. Technology assessment─A tool kit. Chemtech. 1976;372-83.
Coates & Jarratt, Inc. Course Workbook: Technology Assessment. Anticipating the Consequences of Technological Choices. 1992. Washington, DC.
Cutler DM, Ly DP. The (paper) work of medicine: understanding international medical costs. J Econ Perspect. 2011;25(2):3-25. Pubmed | Publisher free article
Cutler DM, McClellan M. Is technological change in medicine worth it? Health Aff (Millwood). 2001;20(5):11-29. Pubmed | Publisher free article
Drug Bioequivalence. Recommendations from the Drug Bioequivalence Study Panel to the Office of Technology Assessment, Congress of the United States. J Pharmacokinet Biopharm. 1974(2):433-66. Pubmed
European Network for Health Technology Assessment. Assessment FAQ. What is Health Technology Assessment (HTA). Accessed March 8, 2018 at: https://www.eunethta.eu/services/submission-guidelines/.
European Parliamentary Technology Assessment. What is TA? 2011. Accessed January 11, 2016 at: http://eptanetwork.org/index.php/about/what-is-ta.
Goyen M, Debatin JF. Healthcare costs for new technologies. Eur J Nucl Med Mol Imaging. 2009;36 Suppl 1:S139-43. Pubmed
Health Technology Assessment International. What is HTA? Accessed Aug. 1, 2013 at: http://www.htai.org/index.php?id=428.
Institute of Medicine. Assessing Medical Technologies. Washington, DC: National Academy Press; 1985. Publisher free book
Kunkle G. New challenges or the past revisited? The Office of Technology Assessment in historical context. Technology in Society 1995;17(2):175-96.
Margolis RM, Guston DH. The origins, accomplishments, and demise of the Office of Technology Assessment. In Morgan MG, Peha JM, eds. Science and Technology Advice for Congress. Washington, DC: Resources for the Future; 2003; 53-76.
Medicare Payment Advisory Commission. Accounting for new technology in hospital prospective payment systems. In Report to the Congress: Medicare Payment Policy. Washington, DC: Medicare Payment Advisory Commission; 2001;33-45. Publisher free publication
National Academy of Engineering, Committee on Public Engineering policy. A Study of Technology Assessment. Washington, DC: US Government Printing Office; 1969.
National Research Council, Committee on the Life Sciences and Social Policy. Assessing Biomedical Technologies: An Inquiry into the Nature of the Process. Washington, DC: National Academy of Sciences; 1975.
Newhouse JP. Medical care costs: how much welfare loss? J Econ Perspect. 1992;6(3):3-21. PubMed | Publisher free article
Smith SD, Heffler SK, Freeland MS. The impact of technological change on health care cost spending: an evaluation of the literature. Washington, DC: Health Care Financing Administration, July 2000. Publisher free publication
UK NHS National Institute for Health Research Health Technology Assessment Programme. Health Technology Assessment. Accessed Jul 22 2019 at: Publisher free publication
UN Branch for Science and Technology for Development. United Nations Workshop on Technology Assessment for Developing Countries. Hosted by the Office of Technology Assessment. Washington, DC: 1991.
US Congress, House of Representatives. Committee on Science and Astronautics. Technology Assessment. Statement of Emilio Q. Daddario, Chairman, Subcommittee on Science Research and Development. 90th Cong., 1st sess., Washington, DC; 1967.
US Congress, Office of Technology Assessment. Protecting Privacy in Computerized Medical Information. Washington, DC: US Government Printing Office; 1993. Publisher free publication
US Congress, Office of Technology Assessment. Technology Assessment in Business and Government. Summary and Analysis. Washington, DC: US Government Printing Office; 1977. Publisher free publication
US Congressional Budget Office. Technological Change and the Growth of Health Care Spending. Pub. No. 2764. Washington DC: Congress of the United States; January 2008. Publisher free publication
Original content last updated: May 2014 (Report date).
II. Fundamental Concepts
This section delves into the core definitions and metrics used in Health Technology Assessment, including how health technologies are categorized and how their impacts are evaluated.
- A. Health Technology
- B. Health Technology Assessment
- C. Properties and Impacts Assessed
- D. Expertise for Conducting HTA
- E. Basic HTA Frameworks
- References for Chapter II
A. Health Technology
Technology is the practical application of knowledge. Health technology is the practical application of knowledge to improve or maintain individual and population health. Three ways to describe health technology include its physical nature, its purpose, and its stage of diffusion.
1. Physical Nature
For many people, the term “technology” connotes mechanical devices or instrumentation; to others, it is a short form of “information technology,” such as computers, networking, software, and other equipment and processes to manage information. However, the practical application of knowledge in health care is quite broad. Main categories of health technology include the following.
- Drugs: e.g., aspirin, beta-blockers, antibiotics, cancer chemotherapy
- Biologics: e.g., vaccines, blood products, cellular and gene therapies
- Devices, equipment and supplies: e.g., cardiac pacemaker, magnetic resonance imaging (MRI) scanner, surgical gloves, diagnostic test kits, mosquito netting
- Medical and surgical procedures: e.g., acupuncture, nutrition counseling, psychotherapy, coronary angiography, gall bladder removal, bariatric surgery, cesarean section
- Public health programs: e.g., water purification system, immunization program, smoking prevention program
- Support systems: e.g., clinical laboratory, blood bank, electronic health record system, telemedicine systems, drug formulary,
- Organizational and managerial systems: e.g., medication adherence program, prospective payment using diagnosis-related groups, alternative health care delivery configurations
Certainly, these categories are interdependent; for example, vaccines are biologics that are used in immunization programs, and screening tests for pathogens in donated blood are used by blood banks.
2. Purpose or Application
Technologies can also be grouped according to their health care purpose, i.e.:
- Prevention: protect against disease by preventing it from occurring, reducing the risk of its occurrence, or limiting its extent or sequelae (e.g., immunization, hospital infection control program, fluoridated water supply)
- Screening: detect a disease, abnormality, or associated risk factors in asymptomatic people (e.g., Pap smear, tuberculin test, screening mammography, serum cholesterol testing)
- Diagnosis: identify the cause and nature or extent of disease in a person with clinical signs or symptoms (e.g., electrocardiogram, serological test for typhoid, x-ray for possible broken bone)
- Treatment: intended to improve or maintain health status or avoid further deterioration (e.g., antiviral therapy, coronary artery bypass graft surgery, psychotherapy)
- Rehabilitation: restore, maintain or improve a physically or mentally disabled person's function and well-being (e.g., exercise program for post-stroke patients, assistive device for severe speech impairment, incontinence aid)
- Palliation: improve the quality of life of patients, particularly for relief of pain, symptoms, discomfort, and stress of serious illness, as well as psychological, social, and spiritual problems. (Although often provided for progressive, incurable disease, palliation can be provided at any point in illness and with treatment, e.g., patient-controlled analgesia, medication for depression or insomnia, caregiver support.)
Not all technologies fall neatly into single categories. Many tests and other technologies used for diagnosis also are used for screening. (The probability that a patient who has a positive test result for a particular disease or condition truly has that disease or condition is greatly affected by whether the test was used for screening asymptomatic patients or diagnosing symptomatic patients. See discussion of “predictive value positive,” below.) Some technologies are used for diagnosis as well as treatment, e.g., coronary angiography to diagnose heart disease and to guide percutaneous coronary interventions. Implantable cardioverter defibrillators detect potentially life-threatening heart arrhythmias and deliver electrical pulses to restore normal heart rhythm. Electronic health record systems can support all of these technological purposes or applications.
Certain “hybrid” or “combination” technologies combine characteristics of drugs, devices or other major categories of technology (Goodman 1993; Lewin Group 2001; Lauritsen 2009). Among the many examples of these are: photodynamic therapy, in which drugs are laser-activated (e.g., for targeted destruction of cancer cells); local drug delivery technologies (e.g., antibiotic bone cement, drug patches, drug inhalers, implantable drug pumps, and drug-eluting coronary artery stents); spermicidal condoms; and bioartificial organs that combine natural tissues and artificial components. Examples of hybrid technologies that have complicated regulatory approval and coverage decisions are positron-emission tomography (PET, used with radiopharmaceuticals) (Coleman 1992), metered-dose inhalers (Massa 2002), and certain targeted drugs that are developed in combination with pharmacogenomic tests that are predictive of patient response to those therapies. These pharmacogenomic test-drug combinations may require clinical trials demonstrating the clinical utility of the tests as well as the safety and efficacy of the accompanying drug (US Food and Drug Administration 2007; Hudson 2011).
3. Stage of Diffusion
Technologies may be assessed at different stages of diffusion and maturity. In general, health care technologies may be described as being:
- Future: in a conceptual stage, anticipated, or in the earliest stages of development
- Experimental: undergoing bench or laboratory testing using animals or other models
- Investigational: undergoing initial clinical (i.e., in humans) evaluation for a particular condition or indication
- Established: considered by clinicians to be a standard approach to a particular condition or indication and diffused into general use
- Obsolete/outmoded/abandoned: superseded by other technologies or demonstrated to be ineffective or harmful
Often, these stages are not clearly delineated, and technologies do not necessarily mature through them in a linear fashion. A technology may be investigational for certain indications, established for others, and outmoded or abandoned for still others, such as autologous bone marrow transplantation with high-dose chemotherapy for certain types of cancers (Rettig 2007). Many technologies undergo multiple incremental innovations after their initial acceptance into general practice (Gelijns 1994; Reiser 1994). A technology that was once considered obsolete may return to established use for a better-defined or entirely different clinical purpose. A prominent example is thalidomide, whose use as a sedative during pregnancy was halted 50 years ago when it was found to induce severe fetal malformation, but which is now used to treat such conditions as leprosy, advanced multiple myeloma, chronic graft vs. host disease, and certain complications of HIV infection (Breitkreutz 2008; Zhou 2013).
B. Health Technology Assessment
Health technology assessment (HTA) is the systematic evaluation of properties, effects or other impacts of health technology. The main purpose of HTA is to inform policymaking for technology in health care, where policymaking is used in the broad sense to include decisions made at, e.g., the individual or patient level, the level of the health care provider or institution, or at the regional, national and international levels. HTA may address the direct and intended consequences of technologies as well as their indirect and unintended consequences. HTA is conducted by interdisciplinary groups using explicit analytical frameworks, drawing from a variety of methods.
1. Purposes of HTA
HTA can be used in many ways to advise or inform technology-related policies and decisions. Among these are to advise or inform:
- Regulatory agencies about whether to permit the commercial use (e.g., marketing) of a drug, device or other regulated technology
- Payers (health care authorities, health plans, drug formularies, employers, etc.) about technology coverage (whether or not to pay), coding (assigning proper codes to enable reimbursement), and reimbursement (how much to pay)
- Clinicians and patients about the appropriate use of health care interventions for a particular patient’s clinical needs and circumstances
- Health professional associations about the role of a technology in clinical protocols or practice guidelines
- Hospitals, health care networks, group purchasing organizations, and other health care organizations about decisions regarding technology acquisition and management
- Standards-setting organizations for health technology and health care delivery regarding the manufacture, performance, appropriate use, and other aspects of health care technologies
- Government health department officials about undertaking public health programs (e.g., immunization, screening, and environmental protection programs)
- Lawmakers and other political leaders about policies concerning technological innovation, research and development, regulation, payment and delivery of health care
- Health care technology companies about product development and marketing decisions
- Investors and companies concerning venture capital funding, acquisitions and divestitures, and other transactions concerning health care product and service companies
- Research agencies about evidence gaps and unmet health needs
Many of the types of organizations noted above, including government and commercial payers, hospital networks, health professional organizations, and others, have their own HTA units or functions. Many HTA agencies are affiliated with national or regional governments or consortia of multiple organizations. Further, there are independent not-for-profit and for-profit HTA organizations.
HTA contributes in many ways to the knowledge base for improving the quality of health care, especially to support development and updating of a wide spectrum of standards, guidelines, and other health care policies. For example, in the US, the Joint Commission (formerly JCAHO) and the National Committee for Quality Assurance (NCQA) set standards for measuring quality of care and services of hospitals, managed care organizations, long-term care facilities, hospices, ambulatory care centers, and other health care institutions. The National Quality Forum (NQF) endorses national evidence-based consensus standards for measuring and reporting across a broad range of health care interventions.
Health professional associations (e.g., American College of Cardiology, American College of Physicians, American College of Radiology) and special panels (e.g., the US Preventive Services Task Force, the joint Department of Veterans Affairs/Department of Defense Clinical Practice Guidelines program) develop clinical practice guidelines, standards, and other statements regarding the appropriate use of technologies (see, e.g., Institute of Medicine 2011). The Guidelines International Network (G-I-N) of organizations and individual members from more than 40 countries supports evidence-based guideline development, adaptation, dissemination, and implementation toward reducing inappropriate practice variation throughout the world. The National Guideline Clearinghouse (NGC, sponsored by the US Agency for Healthcare Research and Quality), is a searchable database of evidence-based clinical practice guidelines. Among the criteria for a new guideline to be included in NGC effective June 2014 is that it be based on a carefully documented systematic review of the evidence, including a detailed search strategy and description of study selection.
Standards-setting organizations such as the American National Standards Institute (ANSI) and the American Society for Testing and Materials coordinate development of voluntary national consensus standards for the manufacture, use, and reuse of health devices and their materials and components. For example, ANSI has developed standards and specifications for electronic information sharing and interoperability in such areas as laboratory results reporting, medication management, personalized health care, immunizations, and neonatal screening (Kuperman 2010).
As noted above, HTA can be used to support decision making by clinicians and patients. The term evidence-based medicine refers to the use of current best evidence from scientific and medical research, and the application of clinical experience and observation, in making decisions about the care of individual patients (Glasziou 2011; Straus 2011). This prompted the appearance of many useful resources, including:
- Evidence-Based Medicine (Sackett 1997), a guide to the field, recently updated (Straus 2011)
- Evidence-Based Medicine (a joint product of the American College of Physicians and the BMJ Publishing Group), a journal digest of articles selected from international medical journals
- “Users’ guides to the medical literature,” a series of more than 30 articles by the Evidence-Based Medicine Working Group, originally published in the Journal of the American Medical Association, starting in the 1990s and more recently assembled and updated (Guyatt 2008)
- Centre for Evidence-Based Medicine
2. Basic HTA Orientations
The impetus for an HTA is not necessarily a particular technology. Three basic orientations to HTA are as follows.
- Technology-oriented assessments are intended to determine the characteristics or impacts of particular technologies. For example, a government agency may want to determine the clinical, economic, social, professional, or other impacts of cochlear implants, cervical cancer screening, PET scanners, or widespread adoption of electronic health record systems.
- Problem-oriented assessments focus on solutions or strategies for managing a particular disease, condition, or other problem for which alternative or complementary technologies might be used. For example, clinicians and other providers concerned with the problem of diagnosis of dementia may call for HTA to inform the development of clinical practice guidelines involving some combination or sequence of clinical history, neurological examination, and diagnostic imaging using various modalities.
- Project-oriented assessments focus on a local placement or use of a technology in a particular institution, program, or other designated project. For example, this may arise when a hospital must decide whether or not to purchase a PET scanner, considering the facilities, personnel, and other resources needed to install and operate a PET scanner; the hospital’s financial status; local market potential for PET services; competitive factors; etc.
These basic assessment orientations can overlap and complement one another. Certainly, all three types could draw on a common body of scientific evidence and other information. A technology-oriented assessment may address the range of problems for which the technology might be used and how appropriate the technology might be for different types of local settings (e.g., inpatient versus outpatient). A problem-oriented assessment may compare the effectiveness, safety, and other impacts of alternative technologies for a given problem, e.g., alternative treatments for atrial fibrillation (e.g., drug therapy, surgery, or catheter ablation), and may draw on technology-oriented assessments of one or more of those alternatives as well as any direct (“head-to-head”) comparisons of them. A project-oriented assessment would consider the range of impacts of a technology or its alternatives in a given setting, as well as the role or usefulness of that technology for various problems. Although the information used in a project-oriented assessment by a particular hospital may include findings of pertinent technology- and problem-oriented assessments, local data collection and analysis may be required to determine what is appropriate for that hospital. Thus, many HTAs will blend aspects of all three basic orientations.
C. Properties and Impacts Assessed
What does HTA assess? HTA may involve the investigation of one or more properties, impacts, or other attributes of health technologies or applications. In general, these include the following.
- Technical properties
- Safety
- Efficacy and/or effectiveness
- Economic attributes or impacts
- Social, legal, ethical and/or political impacts
The properties, impacts, and other attributes assessed in HTA pertain across the range of types of technology. Thus, for example, just as drugs, devices, and surgical procedures can be assessed for safety, effectiveness, and cost effectiveness, so can hospital infection control programs, computer-based drug-utilization review systems, and rural telemedicine networks.
Technical properties include performance characteristics and conformity with specifications for design, composition, manufacturing, tolerances, reliability, ease of use, maintenance, etc.
Safety is a judgment of the acceptability of risk (a measure of the probability of an adverse outcome and its severity) associated with using a technology in a given situation, e.g., for a patient with a particular health problem, by a clinician with certain training, or in a specified treatment setting.
Efficacy and effectiveness both refer to how well a technology works, i.e., accomplishes its intended purpose, usually based on changes in one or more specified health outcomes or “endpoints” as described below. A technology that works under carefully managed conditions does not always work as well under more heterogeneous or less controlled conditions. In HTA, efficacy refers to the benefit of using a technology for a particular problem under ideal conditions, e.g., within the protocol of a carefully managed RCT, involving patients meeting narrowly defined criteria, or conducted at a “center of excellence.” Effectiveness refers to the benefit of using a technology for a particular problem under general or routine conditions, e.g., by a physician in a community hospital for a variety of types of patients. Whereas efficacy answers the question, “Can it work?” (in the best conditions), effectiveness answers the question “Does it work?” (in real-world conditions).
Clinicians, patients, managers and policymakers are increasingly aware of the practical implications of differences in efficacy and effectiveness. Researchers delve into registers, databases (e.g., of third-party payment claims and administrative data), and other epidemiological and observational data to discern possible associations between the use of technologies and patient outcomes in general or routine practice settings. As these are observational studies, their validity for establishing causal connections between interventions and patient outcomes is limited compared to experimental studies, particularly RCTs. Even so, observational studies can be used to generate hypotheses for experimental trials, and they can provide evidence about effectiveness that can complement other evidence about efficacy, suggesting whether findings under ideal conditions may be extended to routine practice. As discussed below, some different types of trials are designed to incorporate varied groups of patients and settings.
Box II-1 shows certain distinctions in efficacy and effectiveness for diagnostic tests. Whereas the relationship between a preventive, therapeutic, or rehabilitative technology and patient outcomes is often direct (though not always easy to measure), the relationship between a technology used for diagnosis or screening and patient outcomes is usually indirect. Also, diagnostic and screening procedures can have their own short-term and long-term adverse health effects, e.g., arising from biopsies, certain radiological procedures, or genetic testing for certain disorders.
Box II-1. Efficacy vs. Effectiveness for Diagnostic Tests
| Efficacy | Effectiveness | |
|---|---|---|
| Patient Population | Homogeneous; patients with coexisting illness often excluded | Heterogeneous; includes all patients who usually have test |
| Procedures | Standardized | Often variable |
| Testing Conditions | Ideal | Conditions of everyday practice |
| Practitioner | Experts | All users |
Adapted from: Institute of Medicine 1989.
Economic attributes or impacts of health technologies can be microeconomic and macroeconomic. Microeconomic concerns include costs, prices, charges, and payment levels associated with individual technologies. Other concerns include comparisons of resource requirements and outcomes (or benefits) of technologies for particular applications, such as cost effectiveness, cost utility, and cost benefit. (Methods for determining these are described in chapter V, Economic Analysis Methods.) Health technology can have or contribute to a broad range of macroeconomic impacts. These include impacts on: a nation’s gross domestic product, national health care costs, and resource allocation across health care and other industrial sectors, and international trade. Health technology can also be a factor in national and global patterns of investment, innovation, competitiveness, technology transfer, and employment (e.g., workforce size and mobility). Other macroeconomic issues that pertain to health technologies include the effects of intellectual property policies (e.g., for patent protection), regulation, third-party payment, and other policy changes that affect technological innovation, adoption, diffusion, and use.
Ethical, legal, and social considerations arise in HTA in the form of normative concepts (e.g., valuation of human life); choices about how and when to use technologies; research and the advancement of knowledge; resource allocation; and the integrity of HTA processes themselves (Heitman 1998). Indeed, the origins of technology assessment called for the field to support policymakers’ broader considerations of technological impacts, such as the “social, economic, and legal implications of any course of action” (US Congress, House of Representatives 1967) and the “short- and long-term social consequences (for example, societal, economic, ethical, legal) of the application of technology” (Banta 1993). More recently, for example, an integral component of the Human Genome Project of the US National Institutes of Health is the Ethical, Legal and Social Implications (ELSI) Research Program (Green 2011). One recently proposed broader framework, “HELPCESS,” includes consideration of: humanitarian, ethical, legal, public relationships, cultural, economic, safety/security, and social implications (Yang 2013).
Whether in health care or other sectors, technological innovation can challenge certain ethical, religious, cultural, and legal norms. Current examples include genetic testing, use of stem cells to grow new tissues, allocation of scarce organs for transplantation, and life-support systems for critically ill patients. For example, the slowly increasing supply of donated kidneys, livers, hearts, lungs, and other solid organs for transplantation continues to fall behind the expanding need for them, raising ethical, social, and political concerns about allocation of scarce, life-saving resources (Huesch 2012; Yoshida 1998). In dialysis and transplantation for patients with end-stage renal disease, ethical concerns arise from patient selection criteria, termination of treatment, and managing non-compliant and other problem patients (Moss 2011; Rettig 1991). Even so, these concerns continue to prompt innovations to overcome organ shortages (Lechler 2005), such as techniques for improving transplantation success rates with organs from marginal donors, organs from living donors, paired and longer chain donation, xenotransplantation (e.g., from pigs), stem cells to regenerate damaged tissues, and the longer-range goal of whole-organ tissue engineering (Soto-Gutierrez 2012).
Technologies that can diminish or strengthen patient dignity or autonomy include, e.g., end-of-life care, cancer chemotherapy, feeding devices, and assistive equipment for moving immobilized patients. Greater involvement of patients, citizens, and other stakeholders in health care decisions, technology design and development, and the HTA process itself is helping to address some concerns about the relationships between patients and health technology. Ethical questions also have led to improvements in informed consent procedures for patients involved in clinical trials.
Allocation of scarce resources to technologies that are expensive, misused, not uniformly accessible, or non-curative can raise broad concerns about equity and squandered opportunities to improve population health (Gibson 2002). The same technologies can pose various challenges in the context of different or evolving societal and cultural norms, economic conditions, and health care system delivery and financing configurations. Even old or “mainstream” technologies can raise concerns in changing social contexts, such as immunization, organ procurement for transplantation, or male circumcision (EUnetHTA 2008). In addition to technologies, certain actual or proposed uses of analytical methods can prompt such concerns; many observers object to using actual or implied cost per quality-adjusted life year (QALY) thresholds in coverage decisions (Nord 2010).
Methods for assessing ethical, legal, and social implications of health technology have been underdeveloped relative to other methods in HTA, although there has been increased attention in recent years to developing frameworks and other guidance for these analyses (Duthie 2011; Potter 2008). More work is needed for translating these implications into policy (Van der Wilt 2000), such as for involving different perspectives in the HTA process in order to better account for identification of the types of effects or impacts that should be assessed, and for values assigned by these different perspectives to life, quality of life, privacy, choice of care, and other matters (Reuzel 2001). Some methods used in analysis of ethical issues in HTA, based on work assembled by the European network for Health Technology Assessment (EUnetHTA), are listed in Box II-2. Recent examination of alternative methods used in ethical analysis in HTA suggests that they can yield similar results, and that having a systematic and transparent approach to ethical analysis is more important than the choice of methods (Saarni 2011).
Box II-2. Methods Used for Ethical Analysis in HTA
| Method | Description |
| Casuistry | Solves morally challenging situations by comparing them with relevant and similar cases where an undisputed solution exists |
| Coherence analysis | Tests the consistency of ethical argumentation, values or theories on different levels, with an ideal goal of a logically coherent set of arguments |
| Principlism | Approaches ethical problems by addressing basic ethical principles, rooted in society’s common morality |
| Interactive, participatory HTA approaches | Involves different stakeholders in a real discourse, to reduce bias and improve the validity and applicability of the HTA |
| Social shaping of technology | Addresses the interaction between society and technology and emphasizes how to shape technology in the best ways to benefit people |
| Wide reflective equilibrium | Aims at a coherent conclusion by a process of reflective mutual adjustment among general principles and particular judgements |
Source: Saarni et al. 2008.
As a form of objective scientific and social inquiry, HTA must be subject to ethical conduct, social responsibility, and cultural differences. Some aspects to be incorporated or otherwise addressed include: identifying and minimizing potential conflicts of interest on the part of assessment staff and expert advisors; accounting for social, demographic, economic, and other dimensions of representativeness and equity in HTA resource allocation and topic selection; and patient and other stakeholder input on topic selection, evidence questions, and relevant outcomes/endpoints.
The terms “appropriate” and “necessary” often are used to describe whether or not a technology should be used in particular circumstances. These are judgments that typically reflect considerations of one or more of the properties and impacts described above. For example, the appropriateness of a diagnostic test may depend on its safety and effectiveness compared to alternative available interventions for particular patient indications, clinical settings, and resource constraints, perhaps as summarized in an evidence-based clinical practice guideline. A technology may be considered necessary if it is likely to be effective and acceptably safe for particular patient indications, and if withholding it would be deleterious to the patient's health (Hilborne 1991; Kahan 1994; Singer 2001).
As described in chapter I, HTA inquires about the unintended consequences of health technologies as well an intended ones, which may involve some or all of the types of impacts assessed. Some unintended consequences include, or lead to, unanticipated uses of technologies. Box II-3 lists some recent examples.
Box II-3. Recent Examples of Unintended Consequences of Health Technology
| Technology | Intended or Original Uses | Unintended Consequences or Unanticipated Uses |
|---|---|---|
| Antibiotics (antibacterials) | Kill or inhibit growth of bacteria that cause infectious diseases | Overuse and improper use leading to multi-drug resistant bacterial strains1 |
| Antiretroviral therapy (ART) | Treatment of HIV/AIDS | Return to risky sexual behaviors in some patient groups2,3,4 |
| Aspirin | Relieve pain, fever, inflammation | Antiplatelet to prevent blood clots5 |
| Bariatric surgery | Weight loss in obese patients | Cure or remission of type 2 diabetes in many of the obese patients6 |
| Medical ultrasonography | Visualizing structures and blood flow in the body in real time | Fetal sex selection7,8,9 |
| Prostate cancer screening with PSA test | Identify men with prostate cancer early enough to cure | Invasive testing, therapies, and adverse effects for men with slow-growing/low-risk cases that will never cause symptoms10,11 |
| Sildenafil | Cardiovascular disorders, especially hypertension (used today for pulmonary arterial hypertension) | Treat male sexual dysfunction12 |
Sources:
1Hollis A, Ahmed Z. Preserving antibiotics, rationally. N Engl J Med. 2013;369(26):2474-6.
2Fu TC, et al. Changes in sexual and drug-related risk behavior following antiretroviral therapy initiation among HIV-infected injection drug users. AIDS. 2012;26(18):2383-91.
3Kembabazi A, et al. Disinhibition in risky sexual behavior in men, but not women, during four years of antiretroviral therapy in rural, southwestern Uganda. PLoS One. 2013;8(7):e69634.
4Tun W, et al. Increase in sexual risk behavior associated with immunologic response to highly active antiretroviral therapy among HIV-infected injection drug users. Clin Infect Dis. 2004;38(8):1167-74.
5Hackam DG, Eikelboom JW. Antithrombotic treatment for peripheral arterial disease. Heart. 2007;93(3):303-8.
6Brethauer SA, et al. Can diabetes be surgically cured? Long-term metabolic effects of bariatric surgery in obese patients with type 2 diabetes mellitus. Ann Surg. 2013;258(4):628-36.
7George SM. Millions of missing girls: from fetal sexing to high technology sex selection in India. Prenat Diagn. 2006 Jul;26(7):604-9.
8Nie JB. Non-medical sex-selective abortion in China: ethical and public policy issues in the context of 40 million missing females. Br Med Bull. 2011;98:7-20.
9Thiele AT, Leier B. Towards an ethical policy for the prevention of fetal sex selection in Canada. J Obstet Gynaecol Can. 2010 Jan;32(1):54-7.
10Hayes JH, Barry MJ. Screening for prostate cancer with the prostate-specific antigen test: a review of current evidence. JAMA. 2014;311(11):1143-9.
11Lin K, Lipsitz R, Miller T, Janakiraman S; U.S. Preventive Services Task Force. Benefits and harms of prostate-specific antigen screening for prostate cancer: an evidence update for the U.S. Preventive Services Task Force. Ann Intern Med. 2008;149(3):192-9.
12Kling J. From hypertension to angina to Viagra. Mod Drug Discov. 1998;1(2):31-8.
1. Measuring Health Outcomes
Health outcome variables are used to measure the safety, efficacy and effectiveness of health care technologies. Main categories of health outcomes are:
- Mortality (death rate)
- Morbidity (disease rate)
- Adverse health events (e.g., harmful side effects)
- Quality of life
- Functional status
- Patient satisfaction
For example, for a cancer treatment, the main outcome of interest may be five-year survival rate; for treatments of coronary artery disease, the main endpoints may be incidence of fatal and nonfatal acute myocardial infarction (heart attack) and recurrence of angina pectoris (chest pain due to poor oxygen supply to the heart). Although mortality, morbidity, and adverse events are usually the outcomes of greatest interest, the other types of outcomes are often important as well to patients and others. Many technologies affect patients, family members, providers, employers, and other interested parties in other important ways; this is particularly true for many chronic diseases. As such, there is increasing emphasis on quality of life, functional status, patient satisfaction, and related types of patient outcomes.
In a clinical trial and other studies comparing alternative treatments, the effect on health outcomes of one treatment relative to another (e.g., a new treatment vs. a control treatment) can be expressed using various measures of treatment effect. These measures compare the probability of a given health outcome in the treatment group with the probability of the same outcome in a control group. Examples are absolute risk reduction, odds ratio, number needed to treat, and effect size. Box II-4 shows how choice of treatment effect measures can give different impressions of study results.
Box II-4. Choice of Treatment Effect Measures Can Give Different Impressions
A study of the effect of breast cancer screening can be used to contrast several treatment effect measures and show how they can give different impressions about the effectiveness of an intervention (Forrow 1992). In 1988, Andersson (1988) reported the results of a large RCT that was conducted to determine the effect of mammographic screening on mortality from breast cancer. The trial involved more than 42,000 women who were over 45 years old. Half of the women were invited to have mammographic screening and were treated as needed. The other women (control group) were not invited for screening.
The report of this trial states that "Overall, women in the study group aged >55 had a 20% reduction in mortality from breast cancer." Although this statement of relative risk reduction is true, it is based on the reduction from an already low-probability event in the control group to an even lower one in the screened group. Calculation of other types of treatment effect measures provides important additional information. The table below shows the number of women aged 55 and breast cancer deaths in the screened group and control group, respectively. Based on these results, four treatment effect measures are calculated.
For example, absolute risk reduction is the difference in the rate of adverse events between the screened group and the control group. In this trial, the absolute risk reduction of 0.0007 means that the absolute effect of screening was to reduce the incidence of breast cancer mortality by 7 deaths per 10,000 women screened, or 0.07%.
| Group | No. of Patients | Deaths from breast cancer | Probability of death from breast cancer | Relative risk reduction1 | Absolute reduction2 | Odds ratio3 | No. needed to screen4 |
|---|---|---|---|---|---|---|---|
| Screened | 13,107 | 35 | Pc= 0.0027 | 20.6% | 0.0007 | 0.79 | 1,429 |
| Control | 13,113 | 44 | Pc= 0.0034 | ─ | ─ | ─ | ─ |
Women in the intervention group were invited to attend mammographic screening at intervals of 18-24 months. Five rounds of screening were completed. Breast cancer was treated according to stage at diagnosis. Mean follow-up was 8.8 years.
1. Relative risk reduction: (Pc- Ps) ÷ Pc
2. Absolute risk reduction: Pc- Ps
3. Odds ratio: [Ps÷ (1 - Ps)] ÷ [Pc÷ (1 - Pc)]
4. Number needed to screen to prevent one breast cancer death: 1 ÷ (Pc- Ps)
Source of number of patients and deaths from breast cancer: Andersson 1988
a. Biomarkers and Surrogate Endpoints
Certain health outcomes or clinical endpoints have particular roles in clinical trials, other research, and HTA, including biomarkers, intermediate endpoints, and surrogate endpoints.
A biomarker (or biological marker) is an objectively measured variable or trait that is used as an indicator of a normal biological process, a disease state, or effect of a treatment (Biomarkers Definitions Working Group 2001). It may be a physiological measurement (height, weight, blood pressure, etc.), blood component or other biochemical assay (red blood cell count, viral load, glycated hemoglobin [HbA1c] level, etc.), genetic data (presence of a specific genetic mutation), or measurement from an image (coronary artery stenosis, cancer metastases).
An intermediate endpoint is a non-ultimate endpoint (e.g., not mortality or morbidity) that may be associated with disease status or progression toward an ultimate endpoint such as mortality or morbidity. They include certain biomarkers (e.g., HbA1c in prediabetes or diabetes, bone density in osteoporosis, tumor progression in cancer) or disease symptoms (e.g., angina frequency in heart disease, measures of lung function in chronic obstructive pulmonary disease). Some intermediate endpoints can serve as surrogate endpoints.
A surrogate endpoint is a measure (typically a biomarker) that is used as a substitute for a clinical endpoint of interest, such as morbidity and mortality. They are used in clinical trials when it is impractical to measure the primary endpoint during the course of the trial, such as when observation of the clinical endpoint would require years of follow-up. A surrogate endpoint is assumed, based on scientific evidence, to be a valid and reliable predictor of a clinical endpoint of interest. As such, changes in a surrogate endpoint should be highly correlated with changes in the clinical endpoint. For example, a long-standing surrogate marker for risk of stroke is hypertension, although understanding continues to evolve of the respective and joint roles of systolic and diastolic pressures in predicting stroke in the general population and in high-risk populations (Malyszko 2013). RCTs of new drugs for HIV/AIDS use biological markers such as virological (e.g., plasma HIV RNA) levels (or “loads”) and immunological (e.g., CD4+ cell counts) levels (Lalezari 2003) as surrogates for mortality and morbidity. Other examples of surrogate endpoints for clinical endpoints are negative cultures for cures of bacterial infections and decrease of intraocular pressure for loss of vision in glaucoma.
b. Quality of Life Measures
Quality of life (QoL) measures, or “health-related quality of life” measures or indexes, are increasingly used along with more traditional outcome measures to assess efficacy and effectiveness, providing a more complete picture of the ways in which health care affects patients. QoL measures capture such dimensions (or domains) as: physical function, social function, cognitive function, anxiety/distress, bodily pain, sleep/rest, energy/fatigue and general health perception. These measures may be generic (covering overall health) or disease-specific. They may provide a single aggregate score or yield a set of scores, each for a particular dimension. Some examples of widely used generic measures are:
- CAHPS (formerly Consumer Assessment of Healthcare Providers and Systems)
- EuroQol (EQ-5D)
- Health Utilities Index
- Nottingham Health Profile
- Quality of Well-Being Scale
- Short Form (12) Health Survey (SF-12)
- Short Form (36) Health Survey (SF-36)
- Sickness Impact Profile
Dimensions of selected generic QoL measures that have been used extensively and that are well validated for certain applications are shown in Box II-5. There is an expanding literature on the relative strengths and weaknesses of these generic QoL indexes, including how sensitive they are to changes in quality of life for people with particular diseases and disorders (Coons 2000; Feeny 2011; Fryback 2007; Kaplan 2011; Kaplan 1998; Post 2001; Saban 2008).
Box II-5. Domains of Selected General Health-Related Quality of Life Indexes
EuroQol EQ-5D (Rabin 2001)
|
· Mobility |
· Pain/discomfort |
|
· Self-care |
· Anxiety/depression |
|
· Usual activities |
Functional Independence Measure (Hsueh 2002; Linacre 1994)
|
· Self-care |
· Communication |
|
· Psychosocial |
|
|
· Mobility |
· Cognition |
Nottingham Health Profile (Doll 1993; Jenkinson 1988)
|
· Physical mobility |
· Energy |
|
· Pain |
· Social isolation |
|
· Sleep |
· Emotional reactions |
Quality of Well-Being Scale (Frosch 2004; Kaplan 1989)
|
· Mobility |
· Social activity |
|
· Physical activity |
· Symptom-problem complex |
Short Form (SF)-36 (Martin 2011; Ware 1992)
|
· Physical functioning |
· Mental health |
|
· Role - physical |
· Role - emotional |
|
· Social functioning |
· Vitality |
|
· Bodily pain |
· General health perceptions |
Sickness Impact Profile (Bergner 1981; de Bruin 1992)
|
· Body care and movement |
· Emotional behavior |
|
· Ambulation |
· Alertness behavior |
|
· Mobility |
· Communication |
|
· Sleep and rest |
· Social interaction |
|
· Home management |
· Work |
|
· Recreation and pastimes |
· Eating |
Some of the diseases or conditions for which there are disease- (or condition-) specific measures are: angina, arthritis, asthma, epilepsy, heart disease, kidney disease, migraine, multiple sclerosis, urinary incontinence, and vision problems. See Box II-6 for dimensions used in selected measures.
Box II-6. Domains of Selected Disease-Specific Health-Related Quality of Life Indexes
Adult Asthma Quality of Life Questionnaire (Juniper 2005; Juniper 1993)
|
· Activity limitations |
· Exposure to environmental stimuli |
|
· Emotional function |
· Symptoms |
Arthritis Impact Measurement Scales (AIMS2) (Söderlin 2004; Meenan 1992)
|
· Mobility |
· Social activity |
|
+ · Walking and bending |
· Support from family and friends |
|
· Hand and finger function |
· Arthritis pain |
|
· Arm function |
· Work |
|
· Self care |
· Level of tension |
|
· Household tasks |
· Mood |
Urinary Incontinence-Specific Quality of Life Instrument (I-QOL) (Patrick 1999; Wagner 1996)
|
· Avoidance and limiting behavior |
· Social embarrassment |
|
· Psychosocial impacts |
Considerable advances have been made in the development and validation of generic and disease-specific measures since the 1980s. These measures are increasingly used by health product companies to differentiate their products from those of competitors, which may have virtually indistinguishable effects on morbidity for particular diseases (e.g., hypertension, depression, arthritis) but may have different side effect profiles that affect patients’ quality of life (Gregorian 2003).
c. Health-Adjusted Life Years: QALYs, DALYs, and More
The category of measures known as health-adjusted life years (HALYs) recognizes that changes in an individual’s health status or the burden of population health should reflect not only the dimension of life expectancy but a dimension of QoL or functional status. Three main types of HALYs are: quality-adjusted life years (QALYs), disability-adjusted life years (DALYs), and healthy-years equivalents (HYEs). One of the attributes of HALYs is that they are not specific to a particular disease or condition.
The QALY is a unit of health care outcome that combines gains (or losses) in length of life with quality of life. QALYs are usually used to represent years of life subsequent to a health care intervention that are weighted or adjusted for the quality of life experienced by the patient during those years (Torrance 1989). QALYs provide a common unit for multiple purposes, including: estimating the overall burden of disease; comparing the relative impact on personal and population health of specific diseases or conditions, comparing the relative impact on personal and population health of specific technologies; and making economic comparisons, such as of the cost-effectiveness (in particular the cost-utility) of different health care interventions. Some health economists and policymakers have proposed setting priorities among alternative health care interventions by selecting among these so as to maximize the additional health gain in terms of QALYs. This is intended to optimize allocation of scarce resources and thereby maximize social welfare (Gold 2002; Johannesson 1993; Mullahy 2001). QALYs are used routinely in assessing the impact or value of technologies by some HTA organizations, e.g., the National Institute for Health and Care Excellence (NICE) in the UK. Box II-7 illustrates the dual dimensions of QALYs, and how an intervention can result in a gain in QALYs.
Box II-7. Gain in Quality-Adjusted Life Years from a New Intervention
QALY = Length of life X Quality Weight
Survival and Quality of Life with Current Treatment

Survival and Quality of Life with New Treatment
QALY Gain is Represented by the Area of Increased Survival and Quality of Life

Although HALYs arise from a common concept of adjusting duration of life by individuals’ experience of quality of life, they differ in ways that have implications for their appropriate use, including for assessing cost-effectiveness. QALYs are used primarily to adjust a person’s life expectancy by the levels of health-related quality of life that the person is predicted to experience during the remainder of life or some interval of it. DALYs are primarily used to measure population disease burden; they are a measure of something ‘lost’ rather than something ‘gained.’ The health-related quality of life weights used for QALYs are intended to represent quality of life levels experienced by individuals in particular health states, whereas the disability weights used for DALYs represent levels of loss of functioning caused by mental or physical disability caused by disease or injury. Another key distinction is that the burden of disability in calculating DALYs depends on one’s age. That is, DALYs incorporate an age-weighting function that assigns different weights to life years lived at different ages. Also, the origins of quality of life weights and disability weights are different (Sassi 2006; Fox-Rushby 2001).
The scale of quality of life used for QALYs can be based on general, multi-attribute QoL indexes or preference survey methods (Bleichrodt 1997; Doctor 2010; Weinstein 2010). The multi-attribute QoL indexes used for this purpose include, e.g., the SF-6D (based on the SF-36), EQ-5D, versions of the Health Utilities Index, and Quality of Well-Being Scale. The preference survey methods are used to elicit the utility or preferences of individuals (including patients, disabled persons, or others) for certain states of health or well-being, such as the standard gamble, time-tradeoff, or rating scale methods (e.g., a visual analog scale). Another preference survey method, the person trade-off, is used for eliciting preferences for the health states of a community or population, although the standard gamble, time tradeoff, and rating scales can be used at that level as well. This scale is typically standardized to a range of 0.0 (death) to 1.0 (perfect health). A scale may allow for ratings below 0.0 for states of disability and distress that some patients consider to be worse than death (Patrick 1994). Some work has been done to capture more dimensions of public preference and to better account for the value attributed to different health care interventions (Dolan 2001; Schwappach 2002). There is general agreement about the usefulness of the standard measures of health outcomes such as QALYs to enable comparisons of the impacts of technologies across diseases and populations, and standard approaches for valuing utilities for different health states. Among the areas of controversy are:
- whether the QALY captures the full range of health benefits,
- that the QALY does not account for social concerns for equity
- whether the QALY is the most appropriate generic preference-based measure of utility
- whether a QALY is the same regardless of who experiences it
- what the appropriate perspective is for valuing health states, e.g., from the perspective of patients with particular diseases or the general public (Whitehead 2010).
Regarding perspective, for example, the values of the general public may not account for adaptation of the patients to changes in health states, and patients’ values may incorporate self-interest. Given this divergence, the appropriate perspective for health state valuations should depend on the context of the decisions or policies to be informed by the evaluation (Stamuli 2011; Oldridge 2008).
QoL measures and QALYs continue to be used in HTA while substantial work continues in reviewing, refining and validating them. As described in chapter V, Economic Analysis Methods, the QALY is often used as the unit of patient outcomes in cost-utility analyses.
2. Performance of Screening and Diagnostic Technologies
Screening and diagnostic tests provide information about the presence of a disease or other health condition. As such, they must be able to discriminate between patients who have a particular disease or condition and those who do not have it. Although the tests used for them are often the same, screening and diagnosis are distinct applications: screening is conducted in asymptomatic patients; diagnosis is conducted in symptomatic patients. As described below, whether a particular test is used for screening or it is used for diagnosis can have a great effect on the probability that the test result truly indicates whether or not a patient has a given disease or other health condition. Although these tests are most often recognized as being used for screening and diagnosis, there are other, related uses of these tests across the spectrum of managing a disease or condition, as listed in Box II-8.
Box II-8. Uses of Tests for Asymptomatic and Symptomatic Patients
Asymptomatic patients (no known disease)
- Susceptibility: presence of a risk factor for a disease (e.g., a gene for a particular form of cancer)
- Presence of (hidden or occult) disease (e.g., Pap smear for cervical cancer)
Symptomatic patients (known or probable disease)
- Diagnosis: presence of a particular disease or condition (e.g., thyroid tests for suspected hyperthyroidism)
- Differential diagnosis: determine which disease or condition a patient has from among multiple possible alternatives (e.g., in a process of elimination using a series of tests to rule out particular diseases or conditions)
- Staging: extent or progression of a disease (e.g., imaging to determine stages of cancer)
- Prognosis: probability of progression of a disease or condition to a particular health outcome
(e.g., a multi-gene test for survival of a particular type of cancer) - Prediction: probability of a treatment to result in progression of a disease or condition to a particular health outcome (e.g., a genetic test for the responsiveness of colorectal cancer to a particular chemotherapy)
- Surveillance: periodic testing for recurrence or other change in disease or condition status
- Monitoring: response to treatment (e.g., response to anticoagulation therapy)
The technical performance of a test depends on multiple factors. Among these are the precision and accuracy of the test, the observer variation in reading the test data, and the relationship between the disease of interest and the designated cutoff level (threshold) of the variable (usually a biomarker) used to determine the presence or absence of that disease. These factors contribute to the ability of a test to detect a disease when it is present and to not detect a disease when it is not present.
A screening or diagnostic test can have four basic types of outcomes, as shown in Box II-9. A true positive test result is one that detects a marker when the disease is present. A true negative test result is one that does not detect the marker when the disease is absent. A false positive test result is one that detects a marker when the disease is absent. A false negative test result is one that does not detect a marker when the disease is present.
Box II-9. Possible Outcomes of a Screening or Diagnostic Test
|
Test Result |
True Disease Status |
|
|
Present |
Absent |
|
|
Positive (+) |
True + |
False + |
|
Negative (-) |
False - |
True - |
Operating characteristics of tests and procedures are measures of their technical performance. These characteristics are based on the probabilities of the four possible types of outcomes of a test noted above. The two most commonly used operating characteristics of screening and diagnostic tests are sensitivity and specificity. Sensitivity measures the ability of a test to detect a particular disease (e.g., a particular type of infection) or condition (a particular genotype) when it is present. Specificity measures the ability of a test to correctly exclude that disease or condition in a person who truly does not have that disease or condition. The sensitivity and specificity of a test are independent of the true prevalence of the disease or condition in the population being tested.
A graphical way of depicting these operating characteristics for a given diagnostic test is with a receiver operating characteristic (ROC) curve, which plots the relationship between the true positive ratio (sensitivity) and false positive ratio (1 - specificity) for all cutoff points of a disease or condition marker. For a perfect test, the area under the ROC curve would be 1.0; for a useless test (no better than a coin flip), the area under the ROC curve would be 0.5. ROC curves help to demonstrate how raising or lowering a cutoff point selected for defining a positive test result affects tradeoffs between correctly identifying people with a disease (true positives) and incorrectly labeling a person as positive who does not have the disease (false positives).
Sensitivity and specificity do not reveal the probability that a given patient really has a disease if the test is positive, or the probability that a given patient does not have the disease if the test is negative. These probabilities are captured by two other operating characteristics, shown in Box II-10. Positive predictive value is the proportion of those patients with a positive test result who actually have the disease. Negative predictive value is the proportion of patients with a negative test result who actually do not have the disease. Unlike sensitivity and specificity, the positive and negative predictive values of a test do depend on the true prevalence of the disease or condition in the population being tested. That is, the positive and negative predictive values of a test result are not constant performance characteristics of a test; they vary with the prevalence of the disease or condition in the population of interest. For example, if a disease is very rare in the population, even tests with high sensitivity and high specificity can have low predictive value positive, generating more false-positive than false negative results.
Box II-10. Operating Characteristics of Diagnostic Tests
|
Characteristic |
Formula |
Definition |
|
Sensitivity |
True Positives True positives + False negatives |
Proportion of people with condition who test positive |
|
Specificity |
True Negatives True negatives + False positives |
Proportion of people without condition who test negative |
|
Positive predictive value |
True Positives True positives + False positives |
Proportion of people with positive test who have condition |
|
Negative predictive value |
True Negatives True negatives + False negatives |
Proportion of people with negative test who do not have condition |
a. Biomarkers and Cutoff Points in Disease Detection
The biomarker for certain diseases or conditions is typically defined as a certain cutoff level of one or more variables. Examples of variables used for biomarkers for particular diseases are systolic and diastolic blood pressure for hypertension, HbA1c level for type 2 diabetes, coronary calcium score for coronary artery disease, and high-sensitivity cardiac troponin T for acute myocardial infarction. The usefulness of such biomarkers in making a definitive finding about presence or absence of a disease or condition varies; many are used in conjunction with information from other tests or patient risk factors. Biomarkers used to detect diseases have distributions in non-diseased as well as in diseased populations. For most diseases, these distributions overlap, so that a single cutoff level does not clearly separate non-diseased from diseased people. For example, an HbA1c level of 6.5% may be designated as the cutoff point for diagnosing type 2 diabetes. In fact, some people whose HbA1c level is lower than 6.5% also have diabetes (as confirmed by other tests), and some people whose HbA1c level is higher than 6.5% do not have diabetes. Lowering the cutoff point to 6.0% or 5.5% will correctly identify more people who are diabetic, but it will also incorrectly identify more people as being diabetic who are not. For diabetes as well as other conditions, clinically useful cutoff points may vary among different population subgroups (e.g., by age or race/ethnicity).
A cutoff point that is set to detect more true positives will also yield more false positives; a cutoff point that is set to detect more true negatives will also yield more false negatives. There are various statistical approaches for determining “optimal” cutoff points, e.g., where the intent is to minimize total false positives and false negatives, with equal weight given to sensitivity and specificity (Perkins 2006). However, the selection of a cutoff point should consider the acceptable risks of false positives vs. false negatives. For example, if the penalty for a false negative test is high (e.g., in patients with a fatal disease for which there is an effective treatment), then the cutoff point is usually set to be highly sensitive to minimize false negatives. If the penalty for a false positive test is high (e.g., leading to confirmatory tests or treatments that are invasive, associated with adverse events, and expensive), then the cutoff point is usually set to be highly specific to minimize false positives. Given the different purposes of screening and diagnosis, and the associated penalties of false positives and false negatives, cutoff points may be set differently for screening and diagnosis of the same disease.
b. Tests and Health Outcomes
Beyond technical performance of screening and diagnostic tests, their effect on health outcomes or health-related quality of life is often less immediate or direct than for other types of technologies. The impacts of most preventive, therapeutic, and rehabilitative technologies on health outcomes can be assessed as direct cause-and-effect relationships between interventions and outcomes. However, the relationship between the use of screening and diagnostic tests and health outcomes is typically indirect, given intervening decisions or other steps between the test and health outcomes. Even highly accurate test results may be ignored or improperly interpreted by clinicians. Therapeutic decisions that are based on test results can have differential effects on patient outcomes. Also, the impact of those therapeutic decisions may be subject to other factors, such as patient adherence to a drug regimen. Even so, health care decision makers and policymakers increasingly seek direct or indirect evidence demonstrating that a test is likely to have an impact on clinical decisions and health care outcomes.
The effectiveness (or efficacy) of a diagnostic (or screening) technology can be determined along a chain of inquiry that leads from technical capacity of a technology to changes in patient health outcomes to cost effectiveness (where relevant to decision makers), as follows.
- Technical capacity. Does the technology perform reliably and deliver accurate information?
- Diagnostic accuracy. Does the technology contribute to making an accurate diagnosis?
- Diagnostic impact. Do the diagnostic results influence use of other diagnostic technologies, e.g., does it replace other diagnostic technologies?
- Therapeutic impact. Do the diagnostic findings influence the selection and delivery of treatment?
- Patient outcome. Does use of the diagnostic technology contribute to improved health of the patient?
- Cost effectiveness. Does use of the diagnostic technology improve the cost effectiveness of health care compared to alternative interventions?
If a diagnostic technology is not effective at any step along this chain, then it is not likely to be effective at any subsequent step. Effectiveness at a given step does not imply effectiveness at a later step (Feeny 1986; Fineberg 1977; Institute of Medicine 1985). An often-cited hierarchy of studies for assessing diagnostic imaging technologies that is consistent with the chain of inquiry noted above is shown in Box II-11. A generic analytical framework of the types of evidence questions that could be asked about the impacts of a screening test is presented in Box II-12. Some groups have developed standards for assessing the quality of studies of the accuracy of screening and diagnostic tests, such as for conducting systematic reviews of the literature on those tests (Smidt 2006; Whiting 2011).
Box II-11. Hierarchical Model of Efficacy for Diagnostic Imaging: Typical Measures of Analysis
Level 1. Technical efficacy
- Resolution of line pairs
- Modulation transfer function change
- Gray-scale range
- Amount of mottle
- Sharpness
Level 2. Diagnostic accuracy efficacy
- Yield of abnormal or normal diagnoses in a case series
- Diagnostic accuracy (% correct diagnoses in case series)
- Sensitivity and specificity in a defined clinical problem setting
- Measures of area under the ROC curve
Level 3. Diagnostic thinking efficacy
- Number (%) of cases in a series in which image judged "helpful" to making the diagnosis
- Entropy change in differential diagnosis probability distribution
- Difference in clinicians' subjectively estimated diagnosis probabilities pre- to post-test information
- Empirical subjective log-likelihood ratio for test positive and negative in a case series
Level 4. Therapeutic efficacy
- Number (%) of times image judged helpful in planning management of patient in a case series
- % of times medical procedure avoided due to image information
- Number (%) of times therapy planned before imaging changed after imaging information obtained (retrospectively inferred from clinical records)
- Number (%) of times clinicians' prospectively stated therapeutic choices changed after information obtained
Level 5. Patient outcome efficacy
- % of patients improved with test compared with/without test
- Morbidity (or procedures) avoided after having image information
- Change in quality-adjusted life expectancy
- Expected value of test information in quality-adjusted life years (QALYs)
- Cost per QALY saved with imaging information
- Patient utility assessment; e.g., Markov modeling; time trade-off
Level 6. Societal efficacy
- Benefit-cost analysis from societal viewpoint
- Cost-effectiveness analysis from societal viewpoint
Source: Thornbury JR, Fryback DG. Technology assessment − An American view. Eur J Radiol. 1992;14(2):147-56.
Box II-12. Example of Analytical Framework of Evidence Questions: Screening

- Is screening test accurate for target condition?
- Does screening result in adverse effects?
- Do screening test results influence treatment decisions?
- Do treatments change intermediate outcomes?
- Do treatments result in adverse effects?
- Do changes in intermediate outcomes predict changes in health outcomes?
- Does treatment improve health outcomes?
- Is there direct evidence that screening improves health outcomes?
Source: Adapted from: Harris RP, Helfand M, Woolf SH, et al. Current methods of the US Preventive Services Task Force. A review of the process. Am J Prev Med. 2001;20(3S):21-35.
For diagnostic (or screening) technologies that are still prototypes or in other early stages of development, there may be limited data on which to base answers to such questions as these. Even so, investigators and advocates of diagnostic technologies should be prepared to describe, at least qualitatively, how the technology might affect diagnostic accuracy, diagnostic impact, therapeutic impact, patient outcomes and cost effectiveness (where appropriate); how these effects might be measured; approximately what levels of performance would be needed to successfully implement the technology; and how further investigations should be conducted to make these determinations.
3. Timing of Assessment
There is no single correct time to conduct an HTA. It is conducted to meet the needs of a variety of policymakers seeking assessment information throughout the lifecycles of technologies. Regulators, payers, clinicians, hospital managers, investors, and others tend to make decisions about technologies at particular junctures, and each may subsequently reassess technologies. Indeed, the determination of a technology's stage of diffusion may be the primary purpose of an assessment. For insurers and other payers, technologies that are deemed “experimental” or “investigational” are usually excluded from coverage, whereas those that are established or generally accepted are usually eligible for coverage (Newcomer 1990; Reiser 1994; Singer 2001).
There are tradeoffs inherent in decisions regarding the timing for HTA. On one hand, the earlier a technology is assessed, the more likely its diffusion can be curtailed if it is unsafe or ineffective (McKinlay 1981). From centuries’ old purging and bloodletting to the more recent autologous bone marrow transplantation with high-dose chemotherapy for advanced breast cancer, the list of poorly evaluated technologies that diffused into general practice before being found to be ineffective and/or harmful continues to grow. Box II-13 shows examples of health care technologies found to be ineffective or harmful after being widely diffused.
Box II-13. Technologies Found to be Ineffective or Harmful for Some or
All Indications After Diffusion
- Autologous bone marrow transplantation with high-dose chemotherapy for advanced breast cancer
- Antiarrhythmic drugs
- Bevacizumab for metastatic breast cancer
- Colectomy to treat epilepsy
- Diethylstilbestrol (DES) to improve pregnancy outcomes
- Electronic fetal monitoring during labor without access to fetal scalp sampling
- Episiotomy (routine or liberal) for birth
- Extracranial-intracranial bypass to reduce risk of ischemic stroke
- Gastric bubble for morbid obesity
- Gastric freezing for peptic ulcer disease
- Hormone replacement therapy for preventing heart disease in healthy menopausal women
- Hydralazine for chronic heart failure
- Intermittent positive pressure breathing
- Mammary artery ligation for coronary artery disease
- Magnetic resonance imaging (routine) for low back pain in first 6 weeks
- Optic nerve decompression surgery for nonarteritic anterior ischemic optic neuropathy
- Oxygen supplementation for premature infants
- Prefrontal lobotomy for mental disturbances
- Prostate-specific antigen (PSA) screening for prostate cancer
- Quinidine for suppressing recurrences of atrial fibrillation
- Radiation therapy for acne
- Rofecoxib (COX-2 inhibitor) for anti-inflammation
- Sleeping face down for healthy babies
- Supplemental oxygen for healthy premature babies
- Thalidomide for sedation in pregnant women
- Thymic irradiation in healthy children
- Triparanol (MER-29) for cholesterol reduction
Sources: Chou 2011; Coplen 1990; Enkin 2000; Feeny 1986; FDA Center for Drug Evaluation and Research 2010; Fletcher 2002; Grimes 1993; Mello 2001; The Ischemic Optic Neuropathy Decompression Trial Research Group 1995; Jüni 2004; Passamani 1991; Peters 2005; Rossouw 2002; Srinivas 2012; Toh 2010; US DHHS1990, 1993; others.
On the other hand, to regard the findings of an early assessment as definitive or final may be misleading. An investigational technology may not yet be perfected; its users may not yet be proficient; its costs may not yet have stabilized; it may not have been applied in enough circumstances to recognize its potential benefits; and its long-term outcomes may not yet be known (Mowatt 1997). As one technology assessor concluded about the problems of when-to-assess: “It’s always too early until, unfortunately, it’s suddenly too late!” (Buxton 1987). Further, the “moving target problem” can complicate HTA. By the time a HTA is conducted, reviewed, and disseminated, its findings may be outdated by changes in a technology, how it is used, its competing technologies (comparators) for a given health problem (indication), the health problems for which it is used, and other factors (Goodman 1996). See chapter VI, Determine Topics for HTA, for further discussion of identification of candidate assessment topics, horizon scanning, setting assessment priorities, reassessment, and the moving target problem.
In recent years, the demand for HTA by health care decision makers has increasingly involved requests for faster responses to help inform emergent decisions. This has led to development of “rapid HTAs” that are more focused, less-comprehensive assessments designed to provide high-level responses to such decision maker requests within approximately four-to-eight weeks. See discussion of rapid HTA in chapter X, Selected Issues in HTA.
Among the factors affecting the timing of HTA is the sufficiency of evidence to undertake an HTA. One of the types of circumstances in which there are tradeoffs in “when to assess” is a coverage decision for a new technology (or new application of an existing technology) for which there is promising, yet non-definitive or otherwise limited, evidence. For some of these technologies, delaying any reimbursement until sufficient evidence is available for a definitive coverage decision could deny access for certain patients with unmet medical need who might benefit. Further, the absence of any reimbursement could slow the generation of evidence. In such instances, payers may provide for coverage with evidence development or other forms of managed entry of the technology in which reimbursement is made for particular indications or other well-defined uses of the technology in exchange for collection of additional evidence. See further discussion of managed entry in chapter X.
D. Expertise for Conducting HTA
Given the variety of impacts addressed and the range of methods that may be used in an assessment, multiple types of experts are needed in HTA. Depending upon the topic and scope of assessment, these include a selection of the following:
- Physicians, nurses, other clinicians
- Managers of hospitals, clinics, nursing homes, and other health care institutions
- Pharmacists and pharmacologists
- Laboratory technicians, radiology technicians, and other allied health professionals
- Biomedical and clinical engineers
- Patients and community representatives
- Epidemiologists
- Biostatisticians
- Economists
- Social scientists
- Decision scientists
- Ethicists
- Lawyers
- Computer scientists/programmers
- Librarians/information specialists
Of course, certain individuals have multiple types of expertise. The set of participants in an HTA depends on the scope and depth of the topic, available resources, and other factors. For example, the standing members of a hospital technology assessment committee might include: the chief executive officer, chief financial officer, physician chief of staff, director of nursing, director of planning, materials manager, and director of biomedical engineering (Sadock 1997; Taylor 1994). Certain clinical specialists, and marketing, legal, and analytical staff and patient or community representatives could be involved as appropriate.
E. Basic HTA Frameworks
There is great variation in the scope, selection of methods and level of detail in the practice of HTA. Nevertheless, most HTA activity involves some form of the following basic steps.
1. Identify assessment topics
2. Specify the assessment problem or questions
3. Determine organizational locus or responsibility for assessment
4. Retrieve available relevant evidence
5. Generate or collect new evidence (as appropriate)
6. Appraise/interpret quality of the evidence
7. Integrate/synthesize evidence
8. Formulate findings and recommendations
9. Disseminate findings and recommendations
10. Monitor impact
Not all assessment programs conduct all of these steps, and they are not necessarily conducted in a linear manner. Many HTA programs rely largely on integrative methods of reviewing and synthesizing data (using systematic reviews and meta-analyses) based on existing relevant primary data studies (reported in journal articles or from epidemiological or administrative data sets). Some assessment efforts involve multiple cycles of retrieving/collecting, interpreting, and integrating evidence before completing an assessment. The steps of appraising and integrating evidence may be done iteratively, such as when individual primary data studies pertaining to a particular evidence question are appraised individually for quality and then are integrated into a body of evidence, which in turn is appraised for its overall quality, as described in chapter III and chapter IV. Depending on the circumstances of an HTA, the dissemination of findings and recommendations and monitoring of impact may not be parts of the HTA itself, although they may be important responsibilities of the sponsoring program or parent organization. As indicated by various chapter and section headings, all ten of the basic steps of HTA listed above are described in this document.
EUnetHTA has developed a “core model” for HTA to serve as a generic framework to enable international collaboration for producing and sharing the results of HTAs (EUnetHTA 2013). Core HTAs are intended to serve as a basis for local (i.e., a particular nation, region, or program) reports, and as such do not contain recommendations on technology use. The core model involves the following domains and production phases (EUnetHTA 2008; Lampe 2009):
EUnetHTA Core Model Domains
1. Health problem and current use of technology
2. Description and technical characteristics of technology
3. Safety
4. Clinical effectiveness
5. Costs and economic evaluation
6. Ethical analysis
7. Organizational aspects
8. Social aspects
9. Legal aspects
EUnetHTA Core Model Phases
1. Definition of the technology to be assessed
2. Definition of project type
3. Relevance of assessment elements
4. Translation of relevant issues into research questions
5. Compiling of a core HTA protocol
6. Research
7. Entering the results
HTA embraces a diverse group of methods. Two of the main types of HTA methods are primary data collection methods and secondary or integrative methods. Primary data methods (described in chapter III) involve collection of original data, such as clinical trials and observational studies. Integrative methods, or secondary or synthesis methods (chapter IV), involve combining data or information from existing sources, including from primary data studies. (Economic analysis methods, chapter V) can involve one or both of primary data methods and integrative methods.
Most HTA programs use integrative approaches, with particular attention to formulating findings that are based on distinguishing between stronger and weaker evidence drawn from available primary data studies. Some HTA programs do collect primary data, or are part of larger organizations that collect primary data. It is not always possible to conduct, or base an assessment on, the most rigorous types of studies. Indeed, policies often must be made in the absence, or before completion, of definitive studies. Given their varying assessment orientations, resource constraints and other factors, HTA programs tend to rely on different combinations of methods. Even so, the general trend in HTA is to call for and emphasize evidence based on the more rigorous and systematic methods.
References for Chapter II
Andersson I, Aspegren K, Janzon L, et al. Mammographic screening and mortality from breast cancer: The Malmö Mammographic Screening Trial. BMJ. 1988; 297(6654):943-8. PubMed | PMC free article.
Banta HD, Luce BR. Health Care Technology and Its Assessment: An International Perspective. New York, NY: Oxford University Press; 1993.
Bergner M, Bobbitt RA, Carter WB, Gilson BS. The Sickness Impact Profile: development and final revision of a health status measure. Med Care. 1981;19(8):787-805.
Biomarkers Definitions Working Group. Biomarkers and surrogate endpoints: preferred definitions and conceptual framework. Clin Pharmacol Ther. 2001;69(3):89-95. PubMed
Bleichrodt H, Johannesson M. Standard gamble, time trade-off and rating scale: experimental results on the ranking properties of QALYs. J Health Econ. 1997;16(2):155-75. PubMed
Breitkreutz I, Anderson KC. Thalidomide in multiple myeloma--clinical trials and aspects of drug metabolism and toxicity. Expert Opin Drug Metab Toxicol. 2008;4(7):973-85. PubMed
Brethauer SA, Aminian A, Romero-Talamás H, Batayyah E, et al. Can diabetes be surgically cured? Long-term metabolic effects of bariatric surgery in obese patients with type 2 diabetes mellitus. Ann Surg. 2013;258(4):628-36. PubMed | PMC free article
Buxton MJ. Problems in the economic appraisal of new health technology: the evaluation of heart transplants in the UK. In Drummond MF, ed. Economic Appraisal of Health Technology in the European Community. Oxford, England. Oxford Medical Publications, 1987.
Chou R, Croswell JM, Dana T, et al. Screening for Prostate Cancer: A Review of the Evidence for the U.S. Preventive Services Task Force. Ann Intern Med. 2011 Dec 6;155(11):762-71. PubMed | Publisher free article
Coleman RE, Briner WH, Siegel BA. Clinical PET scanning. A short-lived orphan. Int J Technol Assess Health Care. 1992;8(4):610-22. PubMed
Coons SJ, Rao S, Keininger DL, Hays RD. A comparative review of generic quality-of-life instruments. Pharmacoeconomics 2000;17(1):13-35. PubMed
Coplen SE, Antman EM, Berlin JA, Hewitt P, Chalmers TC. Efficacy and safety of quinidine therapy for maintenance of sinus rhythm after cardioversion. A meta-analysis of randomized control trials. Circulation. 1990;82(4):1106-16. PubMed
de Bruin AF, de Witte LP, Stevens F, Diederiks JP. Sickness Impact Profile: the state of the art of a generic functional status measure. Soc Sci Med. 1992;35(8):1003-14. PubMed
Doctor JN, Bleichrodt H, Lin HJ. Health utility bias: a systematic review and meta-analytic evaluation. Med Decis Making. 2010;30(1):58-67. PubMed
Dolan P. Utilitarianism and the measurement and aggregation of quality-adjusted life years. Health Care Anal. 2001;9(1):65-76. PubMed
Doll H.A, Black NA, Flood AB, McPherson K. Criterion validation of the Nottingham health profile: patient views of surgery for benign prostatic hypertrophy. Soc Sci Med. 1993;37(1):115‑22. PubMed
Duthie K, Bond K. Improving ethics analysis in health technology assessment. Int J Technol Assess Health Care 2011;27(1):64-70. PubMed
Enkin M, Nelison J, Crowther C, Duley L, et al. A Guide to Effective Care in Pregnancy and Childbirth. 3rd ed. New York, NY: Oxford University Press; 2000.
EUnetHTA (European Network for Health Technology Assessment). HTA Core Model for Medical and Surgical Interventions Version 1.0 Work Package 4. The HTA Core Model. December 2008. Publisher free publication
EUnetHTA. HTA Core Model® Online. National Institute for Health and Welfare. Helsinki; 2019. Accessed June 18, 2014 at: http://www.htacoremodel.info/.
FDA Center for Drug Evaluation and Research. Memorandum to the File: BLA 125085 Avastin (bevacizumab). Regulatory Decision to Withdraw Avastin (bevacizumab) Firstline Metastatic Breast Cancer Indication December 15, 2010. Accessed Sept. 1, 2011 at: //www.fda.gov/downloads/Drugs/DrugSafety/PostmarketDrugSafetyInformationforPatientsandProviders/UCM237171.pdf.
Feeny D, Guyatt G, Tugwell P, eds. Health care Technology: Effectiveness, Efficiency, and Public Policy. Montreal, Canada: Institute for Research on Public Policy; 1986.
Feeny D, Spritzer K, Hays RD, Liu H, et al. Agreement about identifying patients who change over time: cautionary results in cataract and heart failure patients. Med Decis Making. 2012;32(2):273-86. PubMed | PMC free article
Fineberg HV, Bauman R, Sosman M. Computerized cranial tomography: effect on diagnostic and therapeutic plans. JAMA. 1977;238(3):224-7. PubMed
Fletcher SW, Colditz GA. Failure of estrogen plus progestin therapy for prevention. JAMA. 2002;288(3):366-8. PubMed
Forrow L, Taylor WC, Arnold RM. Absolutely relative: how research results are summarized can affect treatment decisions. Am J Med. 1992;92(2):121-94. PubMed
Fox-Rushby JA, Hanson K. Calculating and presenting disability adjusted life years (DALYs) in cost-effectiveness analysis. Health Policy Plan. 2001;16(3):326-31. PubMed | PMC free article
Frosch DL, Kaplan RM, Ganiats TG, Groessl EJ, Sieber WJ, Weisman MH. Validity of self-administered quality of well-being scale in musculoskeletal disease. Arthritis Rheum. 2004;51(1):28-33. PubMed | Publisher free article
Fryback DG, Dunham NC, Palta M, Hanmer J, et al. US norms for six generic health-related quality-of-life indexes from the National Health Measurement study. Med Care. 2007;45(12):1162-70. PubMed | PMC free article
Fu TC, Westergaard RP, Lau B, Celentano DD, Vlahov D, Mehta SH, Kirk GD. Changes in sexual and drug-related risk behavior following antiretroviral therapy initiation among HIV-infected injection drug users. AIDS. 2012;26(18):2383-91. Accessed June 18, 2014 at: //www.ncbi.nlm.nih.gov/pmc/articles/PMC3678983. PubMed
Gelijns A, Rosenberg N. The dynamics of technological change in medicine. Health Aff (Millwood). 1994;13(3):28-46. PubMed | Publisher free article
George SM. Millions of missing girls: from fetal sexing to high technology sex selection in India. Prenat Diagn. 2006 Jul;26(7):604-9. PubMed
Gibson JL, Martin DK, Singer PA. Priority setting for new technologies in medicine: a transdisciplinary study. BMC Health Serv Res. 2002;2(1):14. PubMed | PMC free article
Glasziou P. What is EBM? Evid Based Med. 2011;16(5):129-30. PubMed
Gold MR, Stevenson D, Fryback DG. HALYS and QALYS and DALYS, oh my: similarities and differences in summary measures of population health. Annu Rev Public Health. 2002;23:115-34. PubMed
Goodman C. The moving target problem and other lessons from percutaneous transluminal coronary angioplasty. In: A Szczepura, Kankaanpää J. Assessment of Health Care Technologies: Case Studies, Key Concepts and Strategic Issues. New York, NY: John Wiley & Sons; 1996:29-65.
Goodman CS. Technology assessment in healthcare: a means for pursuing the goals of biomedical engineering. Med Biolog Eng Comput. 1993;31(1):HTA3-10. PubMed
Green ED, Guyer MS; National Human Genome Research Institute. Charting a course for genomic medicine from base pairs to bedside. Nature. 2011;470(7333):204-13. PubMed
Gregorian RS, Golden KA, Bahce A, Goodman C, et al. Antidepressant-induced sexual dysfunction. Ann Pharmacother. 2002;36(10):1577-89. PubMed
Grimes DA. Technology follies: the uncritical acceptance of medical innovation. JAMA. 1993;269(23):3030-3. PubMed
Guyatt G, Rennie D, Meade MO, Cook DJ. Users' Guides to the Medical Literature: A Manual for Evidence-Based Clinical Practice, 2nd Edition. New York: McGraw-Hill, 2008.
Hackam DG, Eikelboom JW. Antithrombotic treatment for peripheral arterial disease. Heart. 2007;93(3):303-8. PubMed | PMC free article
Harris RP, Helfand M, Woolf SH, et al. Current methods of the US Preventive Services Task Force. A review of the process. Am J Prev Med. 2001;20(3S):21-35. PubMed
Hayes JH, Barry MJ. Screening for prostate cancer with the prostate-specific antigen test: a review of current evidence. JAMA. 2014;311(11):1143-9. PubMed
Heitman E. Ethical issues in technology assessment. Conceptual categories and procedural considerations. Int J Technol Assess Health Care. 1998;14(3):544-66. PubMed
Hilborne LH, Leape LL, Kahan JP, Park RE, et al. Percutaneous Transluminal Coronary Angioplasty: A Literature Review of Ratings of Appropriateness and Necessity. Santa Monica, Ca: RAND; 1991. Publisher free publication
Hollis A, Ahmed Z. Preserving antibiotics, rationally. N Engl J Med. 2013;369(26):2474-6. PubMed | Publisher free article]
Hsueh IP, Lin JH, Jeng JS, Hsieh CL. Comparison of the psychometric characteristics of the functional independence measure, 5 item Barthel index, and 10 item Barthel index in patients with stroke. J Neurol Neurosurg Psychiatry. 2002;73(2):188-90. PubMed | PMC free article
Hudson KL. Genomics, health care, and society. N Engl J Med. 2011;365(11):1033-41. PubMed | Publisher free article
Huesch MD. One and done? Equality of opportunity and repeated access to scarce, indivisible medical resources. BMC Med Ethics. 2012;13:11. PubMed | PMC free article
Institute of Medicine. Assessing Medical Technologies. Washington, DC: National Academy Press; 1985. Publisher free book]
Institute of Medicine. Clinical Practice Guidelines We Can Trust. Washington, DC: National Academies Press; 2011. Publisher free book
The Ischemic Optic Neuropathy Decompression Trial Research Group. Optic nerve decompression surgery for nonarteritic anterior ischemic optic neuropathy (NAION) is not effective and may be harmful. JAMA. 1995;273(8):625-32. PubMed
Jenkinson C, Fitzpatrick R, Argyle M. The Nottingham Health Profile: an analysis of its sensitivity to differentiating illness groups. Soc Sci Med. 1988;27(12):1411-4. PubMed
Johannesson M, Pliskin JS, Weinstein MC. Are healthy-years equivalents an improvement over quality-adjusted life years? Med Dec Making. 1993;13(4):281-6.PubMed
Jüni P, Nartey L, Reichenbach S, et al. Risk of cardiovascular events and rofecoxib: cumulative meta-analysis. Lancet. 2004;364(9450):2021-9. PubMed
Juniper EF, Guyatt GH, Ferrie PJ, Griffith LE. Measuring quality of life in asthma. Am Rev Respir Dis. 1993;147(4):832-8. PubMed
Juniper EF, Svensson K, Mörk AC, Ståhl E. Modification of the asthma quality of life questionnaire (standardised) for patients 12 years and older. Health Qual Life Outcomes. 2005;3:58. Pubmed | PMC free article.
Kahan JP, Bernstein SJ, Leape LL, Hilborne LH, Park RE, Parker L, Kamberg CJ, Brook RH. Measuring the necessity of medical procedures. Med Care. 1994;32(4):357-65. PubMed
Kaplan RM, Anderson JP, Wu AW, Mathews WC, Kozin F, Orenstein D. The Quality of Well-being Scale: applications in AIDS, cystic fibrosis, and arthritis. Med Care. 1989; 27(3 Suppl): S27-43. PubMed
Kaplan RM, Ganiats TG, Sieber WJ, Anderson JP. The Quality of Well-Being Scale: critical similarities and differences with SF-36. Int J Qual Health Care. 1998;10(6):509-20. PubMed | Publisher free article
Kaplan RM, Tally S, Hays RD, Feeny D, Ganiats TG, et al. Five preference-based indexes in cataract and heart failure patients were not equally responsive to change. J Clin Epidemiol 2011;64(5):497-506. PubMed | PMC free article
Kembabazi A, Bajunirwe F, Hunt PW, Martin JN, et al. Disinhibition in risky sexual behavior in men, but not women, during four years of antiretroviral therapy in rural, southwestern Uganda. PLoS One. 2013;8(7):e69634. PubMed | PMC free article
Kling J. From hypertension to angina to Viagra. Mod. Drug Discov. 1998;1(2):31-8.
Kuperman GJ, Blair JS, Franck RA, Devaraj S, Low AF; NHIN Trial Implementations Core Services Content Working Group. Developing data content specifications for the nationwide health information network trial implementations. J Am Med Inform Assoc. 2010;17(1):6-12. PubMed | PMC free article
The Lewin Group. Outlook for Medical Technology Innovation. Report 4: The Impact of Regulation and Market Dynamics on Innovation. Washington, DC: AdvaMed; 2001.
Lalezari JP, Henry K, O’Hearn M, et al. Enfuvirtide, an HIV-1 fusion inhibitor, for drug-resistant HIV infection in North and South America. N Engl J Med. 2003;348(22):2175-85. PubMed | Publisher free article
Lampe K, Mäkelä M, Garrido MV, et al.; European network for Health Technology Assessment (EUnetHTA). The HTA core model: a novel method for producing and reporting health technology assessments. Int J Technol Assess Health Care. 2009;25 Suppl 2:9-20. PubMed
Lauritsen KJ, Nguyen T. Combination products regulation at the FDA. Clin Pharmacol Ther. 2009;85(5):468-70. PubMed
Lechler RI, Sykes M, Thomson AW, Turka LA. Organ transplantation--how much of the promise has been realized? Nat Med. 2005;11(6):605-13. PubMed
Lin K, Lipsitz R, Miller T, Janakiraman S; U.S. Preventive Services Task Force. Benefits and harms of prostate-specific antigen screening for prostate cancer: an evidence update for the U.S. Preventive Services Task Force. Ann Intern Med. 2008;149(3):192-9. PubMed
Linacre JM, Heinemann AW, Wright BD, Granger CV, Hamilton BB. The structure and stability of the Functional Independence Measure. Arch Phys Med Rehab. 1994;75(2):127-32. PubMed
Malyszko J, Muntner P, Rysz J, Banach M. Blood pressure levels and stroke: J-curve phenomenon? Curr Hypertens Rep. 2013;15(6):575-81. PubMed | PMC free article
Martin ML, Patrick DL, Gandra SR, Bennett AV, et al. Content validation of two SF-36 subscales for use in type 2 diabetes and non-dialysis chronic kidney disease-related anemia. Qual Life Res 2011;20(6):889-901. PubMed
Massa T. An industry perspective: challenges in the development and regulation of drug-device combination products. In Hanna K, Manning FJ, Bouxsein P, Pope A, eds. Innovation and Invention in Medical Devices. Workshop Summary. Institute of Medicine. Washington, DC: National Academy Press; 2001:16-20. Publisher free book
McKinlay JB. From “promising report” to “standard procedure”: seven stages in the career of a medical innovation. Milbank Memorial Fund Quarterly. 1981;59(3):374-411. PubMed
Meenan RF, Mason JH, Anderson JJ, Guccione AA, Kazis LE. AIMS2. The content and properties of revised and expanded arthritis impact measurement scales health status questionnaire. Arthritis Rheum. 1992;35(1):1-10. PubMed
Mello MM, Brennan TA. The controversy over high-dose chemotherapy with autologous bone marrow transplant for breast cancer. Health Aff (Millwood). 2001;20(5):101-17. PubMed | Publisher free article
Moss AH. Ethical principles and processes guiding dialysis decision-making. Clin J Am Soc Nephrol. 2011;6(9):2313-7. PubMed] | Publisher free article
Mowatt G, Bower DJ, Brebner JA, Cairns JA, et al. When and how to assess fast-changing technologies: a comparative study of medical applications of four generic technologies. Health Technol Assess. 1997;1(14). PubMed | Publisher free article
Mullahy J. Live long, live well: quantifying the health of heterogeneous populations. Health Econ. 2001;10(5):429-40. PubMed
Newcomer LN. Defining experimental therapy − a third party payer's dilemma. N Engl J Med. 1990;323(24):1702-4. PubMed
Nie JB. Non-medical sex-selective abortion in China: ethical and public policy issues in the context of 40 million missing females. Br Med Bull. 2011;98:7-20. PubMed | Publisher free article
Nord E, Enge AU, Gundersen V. QALYs: is the value of treatment proportional to the size of the health gain? Health Econ. 2010;19(5):596-607. PubMed
Oldridge N, Furlong W, Perkins A, Feeny D, Torrance GW. Community or patient preferences for cost-effectiveness of cardiac rehabilitation: does it matter? Eur J Cardiovasc Prev Rehabil. 2008;15(5):608-15. PubMed
Passamani E. Clinical trials: are they ethical? N Engl J Med. 1991;324(22):1589-92. PubMed
Patrick DL, Martin ML, Bushnell DM, Marquis P, Andrejasich CM, Buesching DP: Cultural adaptation of a quality-of-life measure for urinary incontinence. Eur Urol. 1999;36(5):427-35. PubMed
Patrick DL, Starks HE, Cain KC, Uhlmann RF, Pearlman RA. Measuring preferences for health states worse than death. Med Dec Making. 1994;14(1):9-18. PubMed
Perkins NJ, Schisterman EF. The inconsistency of "optimal" cutpoints obtained using two criteria based on the receiver operating characteristic curve. Am J Epidemiol. 2006;163(7):670-5. PubMed | PMC free article
Peters WP, Rosner GL, Vredenburgh JJ, et al. Prospective, randomized comparison of high-dose chemotherapy with stem-cell support versus intermediate-dose chemotherapy after surgery and adjuvant chemotherapy in women with high-risk primary breast cancer: a report of CALGB 9082, SWOG 9114, and NCIC MA-13. J Clin Oncol. 2005;23(10):2191-200. PubMed
Post MW, Gerritsen J, Diederikst JP, DeWittet LP. Measuring health status of people who are wheelchair-dependent: validity of the Sickness Impact Profile 68 and the Nottingham Health Profile. Disabil Rehabil. 2001;23(6):245-53. PubMed
Potter BK, Avard D, Graham ID, et al. Guidance for considering ethical, legal, and social issues in health technology assessment: application to genetic screening. Int J Technol Assess Health Care. 2008;24(4):412-22. PubMed
Rabin R, de Charro F. EQ-5D: a measure of health status from the EuroQol Group. Ann Med. 2001;33(5):337-43. PubMed
Reiser SJ. Criteria for standard versus experimental therapy. Health Aff (Millwood). 1994;13(3):127-36. PubMed Publisher free article
Rettig RA, Jacobson PD, Farquhar CM, Aubry WM. False Hope: Bone Marrow Transplantation for Breast Cancer. New York: Oxford University Press; 2007.
Rettig RA, Levinsky NG, eds. Kidney Failure and the Federal Government. Washington, DC: National Academy Press; 1991. PubMed | Publisher free book
Reuzel RP, van der Wilt GJ, ten Have HA, de Vries Robbe PF. Interactive technology assessment and wide reflective equilibrium. J Med Philos. 2001;26(3):245-61. PubMed
Rossouw JE, Anderson GL, Prentice RL, et al. Risks and benefits of estrogen plus progestin in healthy postmenopausal women: principal results from the Women's Health Initiative randomized controlled trial. JAMA. 2002;288(3):321-33. PubMed
Saarni SI, Braunack-Mayer A, Hofmann B, van der Wilt GJ. Different methods for ethical analysis in health technology assessment: An empirical study. Int J Technol Assess Health Care 2011;27(4):305-12. PubMed
Saban KL, Stroupe KT, Bryant FB, Reda DJ, et al. Comparison of health-related quality of life measures for chronic renal failure: quality of well-being scale, short-form-6D, and the kidney disease quality of life instrument. Qual Life Res. 2008;17(8):1103-15.PubMed
Sackett DL, Richardson WS, Rosenberg W, Haynes RB. Evidence-Based Medicine. New York, NY: Churchill Livingstone, 1997.
Sadock J, Tolman ED. Capital equipment budgeting: changing an art to a science. J Healthc Resour Manag. 1997;15(8):16-21. PubMed
Sassi F. Setting priorities for the evaluation of health interventions: when theory does not meet practice. Health Policy. 2003;63(2):141-54. PubMed
Schwappach DL. Resource allocation, social values and the QALY: a review of the debate and empirical evidence. Health Expect. 2002;5(3):210-22. PubMed
Singer SJ, Bergthold LA. Prospects for improved decision making about medical necessity. Health Aff (Millwood). 2001;20(1):200-6. PubMed | Publisher free article
Smidt N, Rutjes AW, van der Windt DA, Ostelo RW, et al. Reproducibility of the STARD checklist: an instrument to assess the quality of reporting of diagnostic accuracy studies. BMC Med Res Methodol. 2006;6:12. PubMed | PMC free article
Söderlin MK, Kautiainen H, Skogh T, Leirisalo-Repo M. Quality of life and economic burden of illness in very early arthritis. A population based study in southern Sweden. J Rheumatol 2004;31(9):1717-22. PubMed
Soto-Gutierrez A, Wertheim JA, Ott HC, Gilbert TW. Perspectives on whole-organ assembly: moving toward transplantation on demand. J Clin Invest. 2012;122(11):3817-23. PubMed | PMC free article
Sox H, Stern S, Owens D, Abrams HL. Assessment of Diagnostic Technology in Health Care: Rationale, Methods, Problems, and Directions. Institute of Medicine. Washington, DC: National Academy Press; 1989.
Srinivas SV, Deyo RA, Berger ZD. Application of "less is more" to low back pain. Arch Intern Med. 2012;172(13):1016-20. PubMed
Stamuli E. Health outcomes in economic evaluation: who should value health? Br Med Bull. 2011;97:197-210. PubMed
Straus SE, Richardson WS, Glasziou P, Haynes RB. Evidence-Based Medicine: How to Practice and Teach It. 4th ed. New York, NY: Churchill Livingstone Elsevier, 2011.
Taylor KS. Hospital tech assessment teams field requests − and politics. Hosp Health Netw. 1994;68(16):58. PubMed
Thiele AT, Leier B. Towards an ethical policy for the prevention of fetal sex selection in Canada. J Obstet Gynaecol Can. 2010 Jan;32(1):54-7. PubMed
Thornbury JR, Fryback DG. Technology assessment − An American view. Eur J Radiol. 1992;14(2):147-56. PubMed
Toh S, Hernández-Díaz S, Logan R, Rossouw JE, Hernán MA. Coronary heart disease in postmenopausal recipients of estrogen plus progestin therapy: does the increased risk ever disappear? A randomized trial. Ann Intern Med. 2010;152(4):211-7. PubMed | PMC free article
Torrance GW, Feeny D. Utilities and quality-adjusted life years. Int J Technol Assess Health Care. 1989;5(4):559-75. PubMed
Tun W, Gange SJ, Vlahov D, Strathdee SA, Celentano DD. Increase in sexual risk behavior associated with immunologic response to highly active antiretroviral therapy among HIV-infected injection drug users. Clin Infect Dis. 2004;38(8):1167-74. PubMed | Publisher free article
US Congress, House of Representatives. Committee on Science and Astronautics. Technology Assessment. Statement of Emilio Q. Daddario, Chairman, Subcommittee on Science Research and Development. 90th Cong., 1st sess., Washington, DC; 1967.
US Department of Health and Human Services, Agency for Health Care Policy and Research. Extracranial-Intracranial Bypass to Reduce the Risk of Ischemic Stroke. Health Technology Assessment Reports. No. 6. Rockville, Md; 1990. Bookshelf free publication
US Department of Health and Human Services, Agency for Health Care Policy and Research. Intermittent Positive Pressure Breathing: Old Technologies Rarely Die. Rockville, MD; 1993. Publisher free publication
US Food and Drug Administration. Guidance for Industry and FDA Staff. Pharmacogenetic Tests and Genetic Tests for Heritable Markers. June 19, 2007. Accessed June 18, 2014 at: //www.fda.gov/downloads/MedicalDevices/DeviceRegulationandGuidance/GuidanceDocuments/ucm071075.pdf
Van der Wilt GJ, Reuzel R, Banta HD. The ethics of assessing health technologies. Theor Med Bioeth. 2000;21(1):103-15. PubMed
Wagner TH, Patrick DL, Bavendam TG, Martin ML, Buesching DP: Quality of life in persons with urinary incontinence: development of a new measure. Urology 1996;47(1):67-72. PubMed
Ware JE Jr., Sherbourne CD. The MOS 36-item Short Form Health Survey (SF-36): I. conceptual framework and item selection. Med Care. 1992;30(6):473‑83. PubMed
Weinstein MC, Skinner JA. Comparative effectiveness and health care spending--implications for reform. N Engl J Med. 2010;362(5):460-5. PubMed | PMC free article
Whitehead SJ, Ali S. Health outcomes in economic evaluation: the QALY and utilities. Br Med Bull 2010;96:5-21. PubMed | Publisher free article
Whiting PF, Rutjes AW, Westwood ME, et al.; QUADAS-2 Group. QUADAS-2: a revised tool for the quality assessment of diagnostic accuracy studies. Ann Intern Med. 2011;155(8):529-36. PubMed
Yang H. Let genomics go global. The World in 2013. Economist. Nov. 21, 2012. Accessed November 18, 2014 at: http://www.economist.com/news/21566443-life-sciences-are-ready-revolution-it-will-require-collaboration-many-fronts-says-yang.
Yoshida EM. Selecting candidates for liver transplantation: a medical ethics perspective on the microallocation of a scarce and rationed resource. Can J Gastroenterol. 1998;12(3):209-15. PubMed
Zhou S, Wang F, Hsieh TC, Wu JM, Wu E. Thalidomide-a notorious sedative to a wonder anticancer drug. Curr Med Chem. 2013;20(33):4102-8. PubMed | PMC free article
III. Primary Data Methods
This section explores methods for collecting original data in HTA, focusing on different study designs, assessing their quality, and understanding sources of bias and error.
- A. Primary Data Studies: Diverse Attributes
- B. Assessing the Quality of Primary Data Studies
- C. Instruments for Assessing Quality of Individual Studies
- D. Strengths and Limitations of RCTs
- E. Different Study Designs for Different Questions
- F. Complementary Methods for Internal and External Validity
- G. Evidence Hierarchies
- H. Alternative and Emerging Study Designs Relevant to HTA
- I. Collecting New Primary Data
- References for Chapter III
A. Primary Data Studies: Diverse Attributes
Primary data methods involve collection of original data, ranging from more scientifically rigorous approaches for determining the causal effect of health technologies, such as randomized controlled trials (RCTs), to less rigorous ones, such as case series. These study designs can be described and categorized based on multiple attributes or dimensions, e.g.:
- Comparative vs. non-comparative
- Separate (i.e., external) control group vs. no separate (i.e., internal) control group
- Participants (study populations /groups) defined by a health outcome vs. by having been exposed to, or received or been assigned, an intervention
- Prospective vs. retrospective
- Interventional vs. observational
- Experimental vs. non-experimental
- Random assignment vs. non-random assignment of patients to treatment and control groups
All experimental studies are, by definition, interventional studies. Some non-experimental studies can be interventional, e.g., if investigators assign a technology to a patient population but without a control group or with a non-randomized control group, and then assess their outcomes. An interventional cross-sectional design can be used to assess the accuracy of a diagnostic test. Some study designs are better at rigorous demonstration of causality in well-defined circumstances, such as the RCT. Other study designs may be better for reflecting real-world practice, such as pragmatic clinical trials and some observational studies, such as cohort, cross-sectional, or case control studies using data from registries, surveillance, electronic health (or medical) records, and payment claims.
Box III-1. Examples of Experimental and Non-Experimental Study Designs
| Experimental Studies | Non-experimental studies |
|---|---|
| Randomized controlled trial | Prospective cohort |
| Randomized cross-over trial | Retrospective cohort |
| N-of-1-trial | Case-control |
| Group randomized trial | Cross-sectional |
| Non-randomized controlled trial* | Interrupted time series with comparison |
| Pragmatic trials (randomized or non-randomized) | Non-concurrent cohort |
| Interrupted time series without comparison | |
| Before-and-after | |
| Time series | |
| Case Series | |
| Case study |
*A controlled trial in which participants are assigned to treatment and control groups using a method other than randomization, yet intended to form similar groups. Sometimes known as a “quasi-experimental” design.
Box III-1 categorizes various types of primary data studies as experimental and non-experimental. Researchers have developed various frameworks, schemes, and other tools for classifying study designs, such as for the purpose of conducting systematic reviews (Hartling 2010). Box III-2 and Box III-3 show algorithms for identifying study designs. Some of these study designs have alternative names, and some studies use diverse combinations of design attributes.
Box III-2. Study Design Algorithm, Guide to Community Preventive Services

Source: Briss PA, Zasa S, Pappaioanou M, Fielding J, et al. Developing an evidence-based Guide to Community Preventive Services--Am J Prev Med 2000;18(1S):35-43, Copyright © 2000) with permission from Elsevier.
Box III-3. Design Algorithm for Studies of Health Care Interventions*

*Developed, though no longer advocated by, the Cochrane Non-Randomised Studies Methods Group.
Source: Hartling L, et al. Developing and Testing a Tool for the Classification of Study Designs in Systematic Reviews of Interventions and Exposures. Agency for Healthcare Research and Quality; December 2010. Methods Research Report. AHRQ Publication No. 11-EHC-007.
Although the general type of a study design (e.g., RCT, prospective cohort study, case series) conveys certain attributes about the quality of a study (e.g., control group, random assignment), study design type alone is not a good proxy for study quality. More important are the attributes of study design and conduct that diminish sources of bias and random error, as described below.
New types of observational study designs are emerging in the form of patient-centered online registries and related research platforms. For example, PatientsLikeMe, a patient network, is set up for entry of member patient demographic information, treatment history, symptoms, outcome data, and evaluations of treatments, as well as production of individual longitudinal health profiles and aggregated reports. Such patient-centered registries can supplement clinical trials and provide useful postmarket data across heterogeneous patients and circumstances (Frost 2011, Nakamura 2012).
Most HTA programs rely on integrative methods (especially systematic reviews), particularly to formulate findings based on available evidence from primary data studies that are identified through systematic literature searches. Some HTA programs collect primary data, or are part of larger organizations that collect primary data. It is not always possible to conduct, or base an assessment on, the most rigorously designed studies. Indeed, policies and decisions often must be made in the absence, or before completion, of definitive studies. Given their varying assessment purposes, resource constraints, and other factors, HTA programs use evidence from various study designs, although they usually emphasize evidence based on the more rigorous and systematic methods of data collection.
The following sections describe concepts that affect the quality of primary data studies, particularly their ability to yield unbiased and precise estimates of treatment effects and other findings.
B. Assessing the Quality of Primary Data Studies
Our confidence that the estimate of a treatment effect, accuracy of a screening or diagnostic test, or other impact of a health care technology that is generated by a study is correct reflects our understanding of the quality of the study. For various types of interventions, we examine certain attributes of the design and conduct of a study to assess the quality of that study. For example, some of the attributes or criteria that are commonly used to assess the quality of studies for demonstrating the internal validity of the impact of therapies on health outcomes are the following:
- Prospective, i.e., following a study population over time as it receives an intervention or exposure and experiences outcomes, rather than retrospective design
- Experimental rather than observational
- Controlled, i.e., with one or more comparison groups, rather than uncontrolled
- Contemporaneous control groups rather than historical ones
- Internal (i.e., managed within the study) control groups rather than external ones
- Allocation concealment of patients to intervention and control groups
- Randomized assignment of patients to intervention and control groups
- Blinding of patients, clinicians, and investigators as to patient assignment to intervention and control groups
- Large enough sample size (number of patients/participants) to detect true treatment effects with statistical significance
- Minimal patient drop-outs or loss to follow-up of patients (or differences in these between intervention and control groups) for duration of study
- Consistency of pre-specified study protocol (patient populations, assignment to intervention and control groups, regimens, etc.) and outcome measures with the reported (post-study) protocol and outcome measures
Similarly, some attributes that are commonly used for assessing the external validity of the impact of therapies and other technologies on health outcomes include:
- Flexible entry criteria to identify/enroll a patient population that is representative of patient diversity likely to be offered the intervention in practice, including demographic characteristics, risk factors, disease stage/severity, comorbidities
- Large enough patient population to conduct meaningful subgroup analyses (especially for pre-specified subgroups)
- Dosing, regimen, technique, delivery of the intervention consistent with anticipated practice
- Comparator is standard of care or other relevant, clinically acceptable (not-substandard) intervention
- Dosing, regimen, or other forms of delivering the comparator consistent with standard care
- Patient monitoring and efforts to maintain patient adherence comparable to those in practice
- Accompanying/concurrent/ancillary care similar to what will be provided in practice
- Training, expertise, skills of clinicians and other health care providers similar to those available or feasible for providers anticipated to deliver the intervention
- Selection of outcome measures relevant to those experienced by and important to intended patient groups
- Systematic effort to follow-up on all patients to minimize attrition
- Intention-to-treat analysis used to account for all study patients
- Study duration consistent with the course/episode of disease/condition in practice in order to detect outcomes of importance to patients and clinicians
- Multiple study sites representative of type/level of health care settings and patient and clinician experience anticipated in practice
RCTs are designed to maximize internal validity, and are generally regarded as the “gold standard” study design for demonstrating the causal impact of a technology on health care outcomes. However, some attributes that strengthen the internal validity of RCTs tend to diminish RCTs’ external validity. Probing the strengths and limitations of RCTs with respect to internal and external validity is also instructive for understanding the utility of other studies. A variety of design aspects intended to improve the external validity of RCTs and related experimental designs are described briefly later in this chapter.
The commonly recognized attributes of study quality noted above that strengthen internal and external validity of primary data studies are derived from an extensive body of methodological concepts and principles, including those summarized below: confounding and the need for controls, prospective vs. retrospective design, sources of bias, random error, and selected other factors.
1. Types of Validity in Methods and Measurement
Whether they are experimental or non-experimental in design, studies vary in their ability to produce valid findings. Validity refers to how well a study or data collection instrument measures what it is intended to measure. Understanding different aspects of validity helps in comparing strengths and weaknesses of alternative study designs and our confidence in the findings generated by those studies. Although these concepts are often addressed in reference to primary data methods, they generally apply as well to integrative methods.
Internal validity refers to the extent to which the results of a study accurately represent the causal relationship between an intervention and an outcome in the particular circumstances of that study. This includes the extent to which the design and conduct of a study minimize the risk of any systematic (non-random) error (i.e., bias) in the study results. Internal validity can be suspect when biases in the design or conduct of a clinical trial or other study could have affected outcomes, thereby causing the study results to deviate from the true magnitude of the treatment effect. True experiments such as RCTs generally have high internal validity.
External validity refers to the extent to which the results of a study conducted under particular circumstances can be generalized (or are applicable) to other circumstances. When the circumstances of a particular study (e.g., patient characteristics, the technique of delivering a treatment, or the setting of care) differ from the circumstances of interest (e.g., patients with different characteristics, variations in the technique of delivering a treatment, or alternative settings of care), the external validity of the results of that study may be limited.
Construct validity refers to how well a measure is correlated with other accepted measures of the construct of interest (e.g., pain, anxiety, mobility, quality of life), and discriminates between groups known to differ according to the construct. Face validity is the ability of a measure to represent reasonably (i.e., to be acceptable “on its face”) a construct (i.e., a concept, trait, or domain of interest) as judged by someone with knowledge or expertise in the construct.
Content validity refers to the degree to which the set of items of a data collection instrument is known to represent the range or universe of meanings or dimensions of a construct of interest. For example, how well do the domains of a health-related quality of life index for rheumatic arthritis represent the aspects of quality of life or daily functioning that are important to patients with rheumatoid arthritis?
Criterion validity refers to how well a measure, including its various domains or dimensions, is correlated with a known gold standard or definitive measurement, if one exists. The similar concept of concurrent validity refers to how well a measure correlates with a previously validated one, and the ability of a measure to accurately differentiate between different groups at the time the measure is applied. Predictive validity refers to the ability to use differences in a measure of a construct to predict future events or outcomes. It may be considered a subtype of criterion validity.
Convergent validity refers to the extent to which different measures that are intended to measure the same construct actually yield similar results, such as two measures of quality of life. Discriminant validity concerns whether different measures that are intended to measure different constructs actually fail to be positively associated with each other. Convergent validity and discriminant validity contribute to, or can be considered subtypes of, construct validity.
2. Confounding and the Need for Controls
Confounding occurs when any factor that is associated with an intervention has an impact on an outcome that is independent of the impact of the intervention. As such, confounding can “mask” or muddle the true impact of an intervention. In order to diminish any impact of confounding factors, it is necessary to provide a basis of comparing what happens to patients who receive an intervention to those that do not.
The main purpose of control groups is to enable isolating the impact of an intervention of interest on patient outcomes from the impact of any extraneous factors. The composition of the control group is intended to be as close as possible to that of the intervention group, and both groups are managed as similarly as possible, so that the only difference between the groups is that one receives the intervention of interest and the other does not. In controlled clinical trials, the control groups may receive a current standard of care, no intervention, or a placebo.
For a factor to be a confounder in a controlled trial, it must differ for the intervention and control groups and be predictive of the treatment effect, i.e., it must have an impact on the treatment effect that is independent of the intervention of interest. Confounding can arise due to differences between the intervention and control groups, such as differences in baseline risk factors at the start of a trial or different exposures during the trial that could affect outcomes. Investigators may not be aware of all potentially confounding factors in a trial. Examples of potentially confounding factors are age, prevalence of comorbidities at baseline, and different levels of ancillary care. To the extent that potentially confounding factors are present at different rates between comparison groups, a study is subject to selection bias (described below).
Most controlled studies use contemporaneous controls alongside (i.e., constituted and followed simultaneously with) intervention groups. Investigators sometimes rely on historical control groups. However, a historical control group is subject to known or unknown inherent differences (e.g., risk factors or other prognostic factors) from a current intervention group, and environmental or other contextual differences arising due to the passage of time that may confound outcomes. In some instances, including those noted below, historical controls have sufficed to demonstrate definitive treatment effects. In a crossover design study, patients start in one group (intervention or control) and then are switched to the other (sometimes multiple times), thereby acting as their own controls, although such designs are subject to certain forms of bias.
Various approaches are used to ensure that intervention and control groups comprise patients with similar characteristics, diminishing the likelihood that baseline differences between them will confound observed treatment effects. The best of these approaches is randomization of patients to intervention and control groups. Random allocation diminishes the impact of any potentially known or unrecognized confounding factors by tending to distribute those factors evenly across the groups to be compared. “Pseudo-randomization” approaches such as alternate assignment or using birthdays or identification numbers to assign patients to intervention and control groups can be vulnerable to confounding.
Placebo Controls
Among the ongoing areas of methodological controversy in clinical trials is the appropriate use of placebo controls. Issues include: (1) appropriateness of using a placebo in a trial of a new therapy when a therapy judged to be effective already exists, (2) statistical requirements for discerning what may be smaller differences in outcomes between a new therapy and an existing one compared to differences in outcomes between a new therapy and a placebo, (3) concerns about comparing a new treatment to an existing therapy that, except during the trial itself, may be unavailable in a given setting (e.g., a developing country) because of its cost or other economic or social constraints (Rothman 1994; Varmus 1997); and (4) when and how to use the placebo effect to patient advantage. As in other health technologies, surgical procedures can be subject to the placebo effect. Following previous missteps that raised profound ethical concerns, guidance was developed for using “sham” procedures as placebos in RCTs of surgical procedures (Horng 2003). Some instances of patient blinding have been most revealing about the placebo effect in surgery, including arthroscopic knee surgery (Moseley 2002), percutaneous myocardial laser revascularization (Stone 2002), and neurotransplantation surgery (Boer 2002). Even so, the circumstances in which placebo surgery is ethically and scientifically acceptable, as well as practically feasible and acceptable to enrolled patients, may be very limited (Campbell 2011).
In recent years there has been considerable scientific progress in understanding the physiological and psychological basis of the placebo response, prompting efforts to put it to use in improving outcomes. It remains important to control for the placebo effect in order to minimize its confounding effect on evaluating the treatment effect of an intervention. However, once a new drug or other technology is in clinical use, the patient expectations and learning mechanisms contributing to the placebo effect may be incorporated into medication regimens to improve patient satisfaction and outcomes. Indeed, this approach may be personalized based on patient genomics, medical history, and other individual characteristics (Enck 2013).
3. Prospective vs. Retrospective Design
Prospective studies are planned and implemented by investigators using real-time data collection. These typically involve identification of one or more patient groups according to specified risk factors or exposures, followed by collection of baseline (i.e., initial, prior to intervention) data, delivery of interventions of interest and controls, collecting follow-up data, and comparing baseline to follow-up data for the patient groups. In retrospective studies, investigators collect samples of data from past interventions and outcomes involving one or more patient groups.
Prospective studies are usually subject to fewer types of confounding and bias than retrospective studies. In particular, retrospective studies are more subject to selection bias than prospective studies. In retrospective studies, patients’ interventions and outcomes have already transpired and been recorded, raising opportunities for intentional or unintentional selection bias on the part of investigators. In prospective studies, patient enrollment and data collection can be designed to reduce bias (e.g., selection bias and detection bias), which is an advantage over most retrospective studies. Even so, the logistical challenges of maintaining blinding of patients and investigators are considerable and unblinding can introduce performance and detection bias.
Prospective and retrospective studies have certain other relative advantages and disadvantages that render them more or less useful for certain types of research questions. Both are subject to certain types of missing or otherwise limited data. As retrospective studies primarily involve selection and analyses of existing data, they tend to be far less expensive than prospective studies. However, their dependence on existing data makes it difficult to fill data gaps or add data fields to data collection instruments, although they can rely in part on importing and adjusting data from other existing sources. Given the costs of enrolling enough patients and collecting sufficient data to achieve statistical significance, prospective studies tend to be more suited to investigating health problems that are prevalent and yield health outcomes or other events that occur relatively frequently and within short follow-up periods. The typically shorter follow-up periods of prospective studies may subject them to seasonal or other time-dependent biases, whereas retrospective studies can be designed to extract data from longer time spans. Retrospective studies offer the advantage of being able to canvass large volumes of data over extended time periods (e.g., from registries, insurance claims, and electronic health records) to identify patients with specific sets of risk factors or rare or delayed health outcomes, including certain adverse events.
4. Sources of Bias
The quality of a primary data study determines our confidence that the estimated treatment effect in a primary data study is correct. Bias refers to any systematic (i.e., not due to random error) deviation in an observation from the true nature of an event. In clinical trials, bias may arise from any factor that systematically distorts (increases or decreases) the observed magnitude of an outcome (e.g., treatment effect or harm) relative to the true magnitude of the outcome. As such, bias diminishes the accuracy (though not necessarily the precision; see discussion below) of an observation. Biases may arise from inadequacies in the design, conduct, analysis, or reporting of a study.
Major types of bias in comparative primary data studies are described below, including selection bias, performance bias, detection bias, attrition bias, and reporting bias (Higgins, Altman, Gøtzsche 2011; Higgins, Altman, Sterne 2011; Viswanathan 2014). Also noted are techniques and other study attributes that tend to diminish each type of bias. These attributes for diminishing bias also serve as criteria for assessing the quality of individual studies.
Selection bias refers to systematic differences between baseline characteristics of the groups that are compared, which can arise from, e.g., physician assignment of patients to treatments, patient self-selection of treatments, or association of treatment assignment with patient clinical characteristics or demographic factors. Among the means for diminishing selection bias are random sequence generation (random allocation of patients to treatment and control groups) and allocation concealment for RCTs, control groups to diminish confounders in cohort studies, and case matching in case-control studies.
Allocation concealment refers to the process of ensuring that the persons assessing patients for potential entry into a trial, as well as the patients, do not know whether any particular patient will be allocated to an intervention group or control group. This helps to prevent the persons who manage the allocation, or the patients, from influencing (intentionally or not) the assignment of a patient to one group or another. Patient allocation based on personal identification numbers, birthdates, or medical record numbers may not ensure concealment. Better methods include centralized randomization (i.e., managed at one site rather than at each enrollment site); sequentially numbered, opaque, sealed envelopes; and coded medication bottles or containers.
Performance bias refers to systematic differences between comparison groups in the care that is provided, or in exposure to factors other than the interventions of interest. This includes, e.g., deviating from the study protocol or assigned treatment regimens so that patients in control groups receive the intervention of interest, providing additional or co-interventions unevenly to the intervention and control groups, and inadequately blinding providers and patients to assignment to intervention and control groups, thereby potentially affecting whether or how assigned interventions or exposures are delivered. Techniques for diminishing performance bias include blinding of patients and providers (in RCTs and other controlled trials in particular), adhering to the study protocol, and sustaining patients’ group assignments.
Detection (or ascertainment) biasrefers to systematic differences between groups in how outcomes are assessed. These differences may arise due to, e.g., inadequate blinding of outcome assessors regarding patient treatment assignment, reliance on patient or provider recall of events (also known as recall bias), inadequate outcome measurement instruments, or faulty statistical analysis. Whereas allocation concealment is intended to ensure that persons who manage patient allocation, as well as the patients themselves, do not influence patient assignment to one group or another, blinding refers to preventing anyone who could influence assessment of outcomes from knowing which patients have been assigned to one group or another. Knowledge of patient assignment itself can affect outcomes as experienced by patients or assessed by investigators. The techniques for diminishing detection bias include blinding of outcome assessors including patients, clinicians, investigators, and/or data analysts, especially for subjective outcome measures; and validated and reliable outcome measurement instruments and techniques.
Attrition bias refers to systematic differences between comparison groups in withdrawals (drop-outs) from a study, loss to follow-up, or other exclusion of patients/participants and how these losses are analyzed. Ignoring these losses or accounting for them differently between groups can skew study findings, as patients who withdraw or are lost to follow-up may differ systematically from those patients who remain for the duration of the study. Indeed, patients’ awareness of whether they have been assigned to a particular treatment or control group may differentially affect their likelihood of dropping out of a trial. Techniques for diminishing attrition bias include blinding of patients as to treatment assignment, completeness of follow-up data for all patients, and intention-to-treat analysis (with imputations for missing data as appropriate).
Reporting bias refers to systematic differences between reported and unreported findings, including, e.g., differential reporting of outcomes between comparison groups and incomplete reporting of study findings (such as reporting statistically significant results only). Also, narrative and systematic reviews that do not report search strategies or disclose potential conflicts of interest raise concerns about reporting bias as well as selection bias (Roundtree 2009). Techniques for diminishing reporting bias include thorough reporting of outcomes consistent with outcome measures specified in the study protocol, including attention to documentation and rationale for any post-hoc (after the completion of data collection) analyses not specified prior to the study, and reporting of literature search protocols and results for review articles. Reporting bias, which concerns differential or incomplete reporting of findings in individual studies, is not the same as publication bias, which concerns the extent to which all relevant studies on given topic proceed to publication.
Registration of Clinical Trials and Results
Two related sets of requirements have improved clinical trial reporting for many health technologies. These requirements help to diminish reporting bias and publication bias, thereby improving the quality of the evidence available for HTA. Further, they increase the value of clinical trials more broadly to trial participants, patients, clinicians, and other decision makers, and society (Huser 2013).
In the US, the Food and Drug Administration Amendments Act of 2007 (FDAAA) mandates that certain clinical trials of drugs, biologics, and medical devices that are subject to FDA regulation for any disease or condition be registered with ClinicalTrials.gov. A service of the US National Library of Medicine, ClinicalTrials.gov is a global registry and results database of publicly and privately supported clinical studies. Further, FDAAA requires investigators to register the results of these trials, generally no more than 12 months after trial completion. Applicable trials include those that have one or more sites in the US, are conducted under an FDA investigational new drug application (IND) or investigational device exemption (IDE), or involve a drug, biologic, or device that is manufactured in the US and its territories and is exported for research (ClinicalTrials.gov 2012; Zarin 2011).
The International Committee of Medical Journal Editors (ICMJE) requires clinical trial registration as a condition for publication of research results generated by a clinical trial. Although the ICMJE does not advocate any particular registry, it is required that a registry meet certain criteria for investigators to meet the condition for publication. (ClinicalTrials.gov meets these criteria.) ICMJE requires registration of trial methodology but not trials results (ICMJE 2013).
As noted above, study attributes that affect bias can be used as criteria for assessing the quality of individual studies. For example, the use of randomization to reduce selection bias and blinding of outcomes assessors to reduce detection bias are among the criteria used for assessing the quality of clinical trials. Even within an individual study, the extent of certain types of bias may vary for different outcomes. For example, in a study of the impact of a technology on mortality and quality of life, the presence of detection bias and reporting bias may vary for those two outcomes.
Box III-4 shows a set of criteria for assessing risk of bias for benefits for several types of study design based on the main types of risk of bias cited above and used by the US Agency for Healthcare Research and Quality (AHRQ) Evidence-based Practice Centers (EPCs).
5. Random Error
In contrast to the systematic effects of various types of bias, random error is a source of non-systematic deviation of an observed treatment effect or other outcome from a true one. Random error results from chance variation in the sample of data collected in a study (i.e., sampling error). The extent to which an observed outcome is free from random error is precision. As such, precision is inversely related to random error.
Random error can be reduced, but it cannot be eliminated. P-values and confidence intervals account for the extent of random error, but they do not account for systematic error (bias). The main approach to reducing random error is to establish large enough sample sizes (i.e., numbers of patients in the intervention and control groups of a study) to detect a true treatment effect (if one exists) at acceptable levels of statistical significance. The smaller the true treatment effect, the more patients may be required to detect it. Therefore, investigators who are planning an RCT or other study consider the estimated magnitude of the treatment effect that they are trying to detect at an acceptable level of statistical significance, and then “power” (i.e., determine the necessary sample size of) the study accordingly. Depending on the type of treatment effect or other outcome being assessed, another approach to reducing random error is to reduce variation in an outcome for each patient by increasing the number of observations made for each patient. Random error also may be reduced by improving the precision of the measurement instrument used to take the observations (e.g., a more precise diagnostic test or instrument for assessing patient mobility).
6. Role of Selected Other Factors
Some researchers contend that if individual studies are to be assembled into a body of evidence for a systematic review, precision should be evaluated not at the level of individual studies, but when assessing the quality of the body of evidence. This is intended to avoid double-counting limitations in precision from the same source (Viswanathan 2014).
In addition to evaluating internal validity of studies, some instruments for assessing the quality of individual studies evaluate external validity. However, by definition, the external validity of a study depends not only on its inherent attributes, but on the nature of an evidence question for which the study is more or less relevant. An individual study may have high external validity for some evidence questions and low external validity for others. Certainly, some aspects of bias for internal validity noted above may also be relevant to external validity, such as whether the patient populations compared in a treatment and control group represent same or different populations, and whether the analyses account for attrition in a way that represents the population of interest, including any patient attributes that differ between patients who were followed to study completion and those who were lost to follow-up. Some researchers suggest that if individual studies are to be assembled into a body of evidence for a systematic review, then external validity should be evaluated when assessing the quality of the body of evidence, but not at the level of individual studies (Atkins 2004; Viswanathan 2014).
Box III-4. Design-Specific Criteria to Assess Risk of Bias for Benefits
| Risk of bias | Criterion | RCTs | CCTs or cohort | Case-control | Case series | Cross-sectional |
|---|---|---|---|---|---|---|
| Selection bias | Was the allocation sequence generated adequately (e.g., random number table, computer-generated randomization)? | x | ||||
| Was the allocation of treatment adequately concealed (e.g., pharmacy- controlled randomization or use of sequentially numbered sealed envelopes)? | x | |||||
| Were participants analyzed within the groups they were originally assigned to? | x | x | ||||
| Did the study apply inclusion/exclusion criteria uniformly to all comparison groups? | x | x | ||||
| Were cases and controls selected appropriately (e.g., appropriate diagnostic criteria or definitions, equal application of exclusion criteria to case and controls, sampling not influenced by exposure status) | x | |||||
| Did the strategy for recruiting participants into the study differ across study groups? | x | |||||
| Does the design or analysis control account for important confounding and modifying variables through matching, stratification, multivariable analysis, or other approaches? | x | x | x* | x | x | |
| Performance bias | Did researchers rule out any impact from a concurrent intervention or an unintended exposure that might bias results? | x | x | x | x | x |
| Did the study maintain fidelity to the intervention protocol? | x | x | x | x | ||
| Attrition bias | If attrition (overall or differential nonresponse, dropout, loss to follow-up, or exclusion of participants) was a concern, were missing data handled appropriately (e.g., intention-to-treat analysis and imputation)? | x | x | x | x | x |
| Detection bias | In prospective studies, was the length of follow-up different between the groups, or in case-control studies, was the time period between the intervention/exposure and outcome the same for cases and controls? | x | x | x | ||
| Were the outcome assessors blinded to the intervention or exposure status of participants? | x | x | x | x | x | |
| Were interventions/exposures assessed/defined using valid and reliable measures, implemented consistently across all study participants? | x | x | x | x | x | |
| Were outcomes assessed/defined using valid and reliable measures, implemented consistently across all study participants? | x | x | x | x | x | |
| Were confounding variables assessed using valid and reliable measures, implemented consistently across all study participants? | x | x | x | x | ||
| Reporting bias | Were the potential outcomes prespecified by the researchers? Are all prespecified outcomes reported? | x | x | x | x | x |
* Cases and controls should be similar in all factors known to be associated with the disease of interest, but they should not be so uniform as to be matched for the exposure of interest.
Source: Viswanathan M, Ansari MT, Berkman ND, Chang S, et al. Chapter 9. Assessing the risk of bias of individual studies in systematic reviews of health care interventions. In: Methods Guide for Effectiveness and Comparative Effectiveness Reviews. AHRQ Publication No. 10(14)-EHC063-EF. Rockville, MD: Agency for Healthcare Research and Quality. January 2014.
Some quality assessment tools for individual studies account for funding source (or sponsor) of a study and disclosed conflicts of interest (e.g., on the part of sponsors or investigators) as potential sources of bias. Rather than being direct sources of bias themselves, a funding source or a person with a disclosed conflict of interest may induce bias indirectly, e.g., in the form of certain types of reporting bias or detection bias. Also, whether the funding source of research comes is a government agency, non-profit organization, or health technology company does not necessarily determine whether it induces bias. Of course, all of these potential sources of bias should be systematically documented (Viswanathan 2014).
C. Instruments for Assessing Quality of Individual Studies
A variety of assessment instruments are available to evaluate the quality of individual studies. Many of these are for assessing internal validity or risk of bias for benefits and harms; others focus on assessing external validity. These include instruments for assessing particular types of studies (e.g., RCTs, observational studies) and certain types of interventions (e.g., screening, diagnosis, and treatment).
A systematic review identified more than 20 scales (and their modifications) for assessing the quality of RCTs (Olivo 2008). Although most of these had not been rigorously developed or tested for validity and reliability, the systematic review found that one of the original scales, the Jadad Scale (Jadad 1996), shown in Box III-5, was the strongest.
The Cochrane Risk of Bias Tool for RCTs, shown in Box III-6, accounts for the domains of bias noted above (i.e., selection, performance, detection, attrition, and reporting bias), providing criteria for assessing whether there is low, unclear, or high risk of bias for each domain for individual RCTs as well as across a set of RCTs for a particular evidence question (Higgins, Altman, Sterne 2011).
Criteria and ratings for assessing internal validity of RCTs and cohort studies and of diagnostic accuracy studies used by the US Preventive Services Task Force (USPSTF) are shown in Box III-7 and Box III-8, respectively. Box III-9 shows a framework used by the USPSTF to rate the external validity of individual studies. QUADAS-2 is a quality assessment tool for diagnostic accuracy studies (Whiting 2011).
Among their numerous instruments for assessing the quality of individual studies, the AHRQ EPCs use a PICOS framework to organize characteristics that can affect the external validity of individual studies, which are used as criteria for evaluating study quality for internal validity, as shown in Box III-10.
D. Strengths and Limitations of RCTs
For demonstrating the internal validity of a causal relationship between an intervention and one or more outcomes of interest, the well-designed, blinded (where feasible), appropriately powered, well-conducted, and properly reported RCT has dominant advantages over other study designs. Among these, the RCT minimizes selection bias in that any enrolled patient has the same probability, due to randomization, of being assigned to an intervention group or control group. This also minimizes the potential impact of any known or unknown confounding factors (e.g., risk factors present at baseline), because randomization tends to distribute such confounders evenly across the groups to be compared.
When the sample size of an RCT is calculated to achieve sufficient statistical power, it minimizes the probability that the observed treatment effect will be subject to random error. Further, especially with larger groups, randomization enables patient subgroup comparisons between intervention and control groups. The primacy of the RCT remains even in an era of genomic testing and expanding use of biomarkers to better target selection of patients for adaptive clinical trials of new drugs and biologics, and advances in computer-based modeling that may replicate certain aspects of RCTs (Ioannidis 2013).
Box III-5. Jadad Instrument to Assess the Quality of RCT Reports
This is not the same as being asked to review a paper. It should not take more than 10 minutes to score a report and there are no right or wrong answers.
Please read the article and try to answer the following questions:
- Was the study described as randomized (this includes the use of words such as randomly, random, and randomization)?
- Was the study described as double blind?
- Was there a description of withdrawals and dropouts?
Scoring the items:
Either give a score of 1 point for each “yes” or 0 points for each “no.” There are no in-between marks.
Give 1 additional point if: For question 1, the method to generate the sequence of randomization was described and it was appropriate (table of random numbers, computer generated, etc.)
and/or: If for question 2, the method of double blinding was described and it was appropriate (identical placebo, active placebo, dummy, etc.)
Deduct 1 point if: For question 1, the method to generate the sequence of randomization was described and it was inappropriate (patients were allocated alternately, or according to date of birth, hospital number, etc.)
and/or: for question 2, the study was described as double blind but the method of blinding was inappropriate (e.g., comparison of tablet vs. injection with no double dummy)
Guidelines for Assessment
1. Randomization: A method to generate the sequence of randomization will be regarded as appropriate if it allowed each study participant to have the same chance of receiving each intervention and the investigators could not predict which treatment was next. Methods of allocation using date of birth, date of admission, hospital numbers, or alternation should not be regarded as appropriate.
2. Double blinding: A study must be regarded as double blind if the word “double blind” is used. The method will be regarded as appropriate if it is stated that neither the person doing the assessments nor the study participant could identify the intervention being assessed, or if in the absence of such a statement the use of active placebos, identical placebos, or dummies is mentioned.
3. Withdrawals and dropouts: Participants who were included in the study but did not complete the observation period or who were not included in the analysis must be described. The number and the reasons for withdrawal in each group must be stated. If there were no withdrawals, it should be stated in the article. If there is no statement on withdrawals, this item must be given no points.
Reprinted from: Jadad AR, et al. Assessing the quality of reports of randomized clinical trials: Is blinding necessary? Control Clin Trials. 1996;17:1-12, Copyright © (1996) with permission from Elsevier.
Box III-6. The Cochrane Collaboration’s Tool for Assessing Risk of Bias
Selection bias.
| Domain | Support for Judgment | Review authors’ judgement |
|---|---|---|
| Allocation concealment. | Describe the method used to conceal the allocation sequence in sufficient detail to determine whether intervention allocations could have been foreseen in advance of, or during, enrolment. | Selection bias (biased allocation to interventions) due to inadequate concealment of allocations prior to assignment. |
Performance bias
| Domain | Support for Judgment | Review authors’ judgement |
|---|---|---|
| Blinding of participants and personnel Assessments should be made for each main outcome (or class of outcomes). | Describe all measures used, if any, to blind study participants and personnel from knowledge of which intervention a participant received. Provide any information relating to whether the intended blinding was effective. | Performance bias due to knowledge of the allocated interventions by participants and personnel during the study. |
Detection bias.
| Domain | Support for Judgment | Review authors’ judgement |
|---|---|---|
| Blinding of outcome assessment Assessments should be made for each main outcome (or class of outcomes). | Describe all measures used, if any, to blind outcome assessors from knowledge of which intervention a participant received. Provide any information relating to whether the intended blinding was effective. | Detection bias due to knowledge of the allocated interventions by outcome assessors. |
Attrition bias.
| Domain | Support for Judgment | Review authors’ judgement |
|---|---|---|
| Incomplete outcome data Assessments should be made for each main outcome (or class of outcomes). | Describe the completeness of outcome data for each main outcome, including attrition and exclusions from the analysis. State whether attrition and exclusions were reported, the numbers in each intervention group (compared with total randomized participants), reasons for attrition/exclusions where reported, and any re-inclusions in analyses performed by the review authors. | Attrition bias due to amount, nature or handling of incomplete outcome data. |
Reporting bias.
| Domain | Support for Judgment | Review authors’ judgement |
|---|---|---|
| Selective reporting. | State how the possibility of selective outcome reporting was examined by the review authors, and what was found. | Reporting bias due to selective outcome reporting. |
Other bias.
| Domain | Support for Judgment | Review authors’ judgement |
|---|---|---|
| Other sources of bias. | State any important concerns about bias not addressed in the other domains in the tool.If particular questions/entries were pre-specified in the review’s protocol, responses should be provided for each question/entry. | Bias due to problems not covered elsewhere in the table. |
Reprinted with permission: Higgins JPT, Altman DG, Sterne, JAC, eds. Chapter 8: Assessing risk of bias in included studies. In: Higgins JPT, Green S, eds. Cochrane Handbook for Systematic Reviews of Interventions Version 5.1.0 [updated March 2011]. The Cochrane Collaboration, 2011."
Box III-7. Criteria for Assessing Internal Validity of Individual Studies:
Randomized Controlled Trials and Cohort Studies, USPSTF
Criteria:
- Initial assembly of comparable groups:
- For RCTs: adequate randomization, including first concealment and whether potential confounders were distributed equally among groups.
- For cohort studies: consideration of potential confounders with either restriction or measurement for adjustment in the analysis; consideration of inception cohorts.
- Maintenance of comparable groups (includes attrition, cross-overs, adherence, contamination).
- Important differential loss to follow-up or overall high loss to follow-up.
- Measurements: equal, reliable, and valid (includes masking of outcome assessment).
- Clear definition of interventions.
- All important outcomes considered.
- Analysis: adjustment for potential confounders for cohort studies, or intention to treat analysis for RCTs.
Definitions of ratings based on above criteria:
Good: Meets all criteria: Comparable groups are assembled initially and maintained throughout the study (follow-up at least 80 percent); reliable and valid measurement instruments are used and applied equally to the groups; interventions are spelled out clearly; all important outcomes are considered; and appropriate attention to confounders in analysis. In addition, for RCTs, intention to treat analysis is used.
Fair: Studies will be graded “fair” if any or all of the following problems occur, without the fatal flaws noted in the "poor" category below: Generally comparable groups are assembled initially but some question remains whether some (although not major) differences occurred with follow-up; measurement instruments are acceptable (although not the best) and generally applied equally; some but not all important outcomes are considered; and some but not all potential confounders are accounted for. Intention to treat analysis is done for RCTs.
Poor: Studies will be graded “poor” if any of the following fatal flaws exists: Groups assembled initially are not close to being comparable or maintained throughout the study; unreliable or invalid measurement instruments are used or not applied at all equally among groups (including not masking outcome assessment); and key confounders are given little or no attention. For RCTs, intention to treat analysis is lacking.
Source: US Preventive Services Task Force Procedure Manual. AHRQ Pub. No. 08-05118-EF, July 2008.
Box III-8. Criteria for Assessing Internal Validity of Individual Studies:
Diagnostic Accuracy Studies, USPSTF
Criteria:
- Screening test relevant, available for primary care, adequately described.
- Study uses a credible reference standard, performed regardless of test results.
- Reference standard interpreted independently of screening test.
- Handles indeterminate results in a reasonable manner.
- Spectrum of patients included in study.
- Sample size.
- Administration of reliable screening test.
Definitions of ratings based on above criteria:
Good: Evaluates relevant available screening test; uses a credible reference standard; interprets reference standard independently of screening test; reliability of test assessed; has few or handles indeterminate results in a reasonable manner; includes large number (more than 100) broad-spectrum patients with and without disease.
Fair: Evaluates relevant available screening test; uses reasonable although not best standard; interprets reference standard independent of screening test; moderate sample size (50 to 100 subjects) and a "medium" spectrum of patients.
Poor: Has fatal flaw such as: Uses inappropriate reference standard; screening test improperly administered; biased ascertainment of reference standard; very small sample size or very narrow selected spectrum of patients.
Source: US Preventive Services Task Force Procedure Manual. AHRQ Pub. No. 08-05118-EF, July 2008.
Box III-9. Global Rating of External Validity (Generalizability) of Individual Studies,
US Preventive Services Task Force
External validity is rated "good" if:
- The study differs minimally from the US primary care population/situation/providers and only in ways that are unlikely to affect the outcome; it is highly probable (>90%) that the clinical experience with the intervention observed in the study will be attained in the US primary care setting.
External validity is rated "fair" if:
- The study differs from the US primary care population/situation/providers in a few ways that have the potential to affect the outcome in a clinically important way; it is only moderately probable (50%-89%) that the clinical experience with the intervention in the study will be attained in the US primary care setting.
External validity is rated "poor" if:
- The study differs from the US primary care population/ situation/ providers in many way that have a high likelihood of affecting the clinical outcomes; the probability is low (<50%) that the clinical experience with the intervention observed in the study will be attained in the US primary care setting.
Source: US Preventive Services Task Force Procedure Manual. AHRQ Pub. No. 08-05118-EF, July 2008.
Box III-10. Characteristics of Individual Studies That May Affect Applicability (AHRQ)
Population
- Narrow eligibility criteria and exclusion of those with comorbidities
- Large differences between demographics of study population and community patients
- Narrow or unrepresentative severity, stage of illness, or comorbidities
- Run in period with high-exclusion rate for non-adherence or side effects
- Event rates much higher or lower than observed in population-based studies
Intervention
- Doses or schedules not reflected in current practice
- Intensity and delivery of behavioral interventions that may not be feasible for routine use
- Monitoring practices or visit frequency not used in typical practice
- Older versions of an intervention no longer in common use
- Co-interventions that are likely to modify effectiveness of therapy
- Highly selected intervention team or level of training/proficiency not widely available
Comparator
- Inadequate dose of comparison therapy
- Use of substandard alternative therapy
Outcomes
- Composite outcomes that mix outcomes of different significance
- Short-term or surrogate outcomes
Setting
- Standards of care differ markedly from setting of interest
- Specialty population or level of care differs from that seen in community
Source: Atkins D, et al. Chapter 6. Assessing the Applicability of Studies When Comparing Medical Interventions. In: Methods Guide for Effectiveness and Comparative Effectiveness Reviews. AHRQ Publication No. 10(12)-EHC063-EF. Rockville, MD: Agency for Healthcare Research and Quality. September 2013.
As described below, despite its advantages for demonstrating internal validity of causal relationships, the RCT is not the best study design for all evidence questions. Like all methods, RCTs have limitations. RCTs can have particular limitations regarding external validity. The relevance or impact of these limitations varies according to the purposes and circumstances of study. In order to help inform health care decisions in real-world practice, evidence from RCTs and other experimental study designs should be augmented by evidence from other types of studies. These and related issues are described below.
RCTs can cost in the tens or hundreds of millions of dollars, and exceeding $1 billion in some instances. Costs can be particularly high for phase III trials of drugs and biologics conducted to gain market approval by regulatory agencies. Included are costs of usual care and the additional costs of conducting research. Usual care costs include those for, e.g., physician visits, hospital stays, laboratory tests, radiology procedures, and standard medications, which are typically covered by third-party payers. Research-only costs (which would not otherwise occur for usual care) include patient enrollment and related management; investigational technologies; additional tests and procedures done for research purposes; additional time by clinical investigators; data infrastructure, management, collection, analysis, and reporting; and regulatory compliance and reporting (DiMasi 2003; Morgan 2011; Roy 2012). Costs are higher for trials with large numbers of enrollees, large numbers of primary and secondary endpoints (requiring more data collection and analysis), and longer duration. Costs are generally high for trials that are designed to detect treatment effects that are anticipated to be small (therefore requiring large sample sizes to achieve statistical significance) or that require extended follow-up to detect differences in, e.g., survival and certain health events.
A clinical trial is the best way to assess whether an intervention works, but it is arguably the worst way to assess who will benefit from it (Mant 1999).
Most RCTs are designed to investigate the effects of a uniformly delivered intervention in a specific type of patient in specific circumstances. This helps to ensure that any observed difference in outcomes between the investigational treatment and comparator is less likely to be confounded by variations in the patient groups compared, the mode of delivering the intervention, other previous and current treatments, health care settings, and other factors. However, while this approach strengthens internal validity, it can weaken external validity.
Patients who enroll in an RCT are typically subject to inclusion and exclusion criteria pertaining to, e.g., age, comorbidities, other risk factors, and previous and current treatments. These criteria tend to yield homogeneous patient groups that may not represent the diversity of patients that would receive the interventions in real practice. RCTs often involve special protocols of care and testing that may not be characteristic of general care, and are often conducted in university medical centers or other special settings. Findings from these RCTs may not be applicable to different practice settings for variations in the technique of delivering the intervention.
When RCTs are conducted to generate sufficient evidence for gaining market approval or clearance, they are sometimes known as “efficacy trials” in that they may establish only short-term efficacy (rather than effectiveness) and safety in a narrowly selected group of patients. Given the patient composition and the choice of comparator, results from these RCTs can overstate how well a technology works as well as under-represent the diversity of the population that will ultimately use the technology.
Given the high costs of RCTs and sponsors’ incentives to generate findings, such as to gain market approval for regulated technologies, these trials may be too small (i.e., have insufficient statistical power) or too short in duration to detect rare or delayed outcomes, including adverse events, and other unintended impacts. On the other hand, even in large, long-term RCTs (as well as other large studies), an observed statistically significant difference in adverse events may arise from random error, or these events may simply happen to co-occur with the intervention rather than being caused by it (Rawlins 2008). As such, the results from RCTs may be misleading or insufficiently informative for clinicians, patients, and payers who make decisions pertaining to more heterogeneous patients and care settings.
Given their resource constraints and use to gain market approval for regulated technologies, RCTs may be designed to focus on a small number of outcomes, especially shorter-term intermediate endpoints or surrogate endpoints rather than ultimate endpoints such as mortality, morbidity, or quality of life. As such, findings from these RCTs may be of limited use to clinicians and patients. Of course, the use of validated surrogate endpoints is appropriate in many instances, including when the health impact of interventions for some health care conditions will not be realized for years or decades, e.g., screening for certain cancers, prevention of risky health behaviors, and management of hypertension and dyslipidemia to prevent strokes and myocardial infarction in certain patient groups.
RCTs are traditionally designed to test a null hypothesis, i.e., the assumption by investigators that there is no difference between intervention and control groups. This assumption often does not pertain for several reasons. Among these, the assumption may be unrealistic when findings of other trials (including phase II trials for drugs and biologics) of the same technology have detected a treatment effect. Further, it is relevant only when the trial is designed to determine if one intervention is better than another, in contrast to whether they can be considered equivalent or one is inferior to the other (Rawlins 2008). Testing of an “honest” null hypothesis in an RCT is consistent with the principle of equipoise, which refers to a presumed state of uncertainty regarding whether any one of alternative health care interventions will confer more favorable outcomes, including balance of benefits and harms (Freedman 1987). However, there is controversy regarding whether this principle is realistic and even whether it is always ethical (Djulbegovic 2009; Fries 2004; Veatch 2007).
RCTs depend on principles of probability theory whose validity may be diminished in health care research, including certain aspects of the use of p-values and multiplicity, which refers to analyses of numerous endpoints in the same data set, stopping rules for RCTs that involve “multiple looks” at data emerging from the trial, and analysis of numerous subgroups. Each of these types of multiplicity involve iterative (repeated) tests of statistical significance based on conventional p-value thresholds (e.g., <0.05). Such iterative tests are increasingly likely to result in at least one false-positive finding, whether for an endpoint, a decision to stop a trial, or patient subgroup in which there appears to be a statistically significant treatment effect (Rawlins 2008; Wang 2007).
Using a p-value threshold (e.g., p<0.01 or p<0.05) as the basis for accepting a treatment effect can be misleading. There is still a chance (e.g., 1% or 5%) that the difference is due to random error. Also, a statistically significant difference detected with a large sample size may have no clinical significance. On the other hand, a finding of no statistical significance (e.g., p>0.01 or p>0.05) does not prove the absence of a treatment effect, including because the sample size of the RCT may have been too small to detect a true treatment effect. The reliance of most RCTs on p-values, particularly that the probability that a conclusion is in error can be determined from the data in a single trial, ignores evidence from other sources or the plausibility of the underlying cause-and-effect mechanism (Goodman 2008).
As noted below, other study designs are preferred for many types of evidence questions, even in some instances when the purpose is to determine the causal effect of a technology. For investigating technologies for treating rare diseases, the RCT may be impractical for enrolling and randomizing sufficient numbers of patients to achieve the statistical power to detect treatment effects. On the other hand, RCTs may be unnecessary for detecting very large treatment effects, especially where patient prognosis is well established and historical controls suffice.
To conduct an RCT may be judged unethical in some circumstances, such as when patients have a largely fatal condition for which no effective therapy exists. Use of a placebo control alone can be unethical when an effective standard of care exists and withholding it poses great health risk to patients, such as for HIV/AIDS prevention and therapy and certain cancer treatments. RCTs that are underpowered (i.e., with sample sizes too small to detect a true treatment effect or that yield statistically significant effects that are unreliable) can yield overestimated treatment effects and low reproducibility of results, thereby raising ethical concerns about wasted resources and patients’ commitments (Button 2013).
E. Different Study Designs for Different Questions
RCTs are not the best study design for answering all evidence questions of potential relevance to an HTA. As noted in Box III-11, other study designs may be preferable for different questions. For example, the prognosis for a given disease or condition may be based on a follow-up studies of patient cohorts at uniform points in the clinical course of a disease. Case control studies, which are usually
Box III-11. RCTs Are Not the Best Study Design for All Evidence Questions
Other study designs may include the following (not a comprehensive list):
- Prevalence of a disease/disorder/trait? Random sample survey of relevant population
- Identification of risk factors for a disease/disorder/adverse event? Case control study (for rare outcome) or cohort study (for more common outcome)
- Prognosis? Patient cohort studies with follow-up at uniform points in clinical course of disease/disorder
- Accuracy and reliability of a diagnostic test? Cross-over study of index test (new test) vs. reference method (“gold standard”) in cohort of patients at risk of having disease/disorder
- Accuracy and reliability of a screening test? Cross-over study of index test vs. reference method (“gold standard”) in representative cross-section of asymptomatic population at-risk for trait/disorder/preclinical disease
- Efficacy/effectiveness (for health outcomes) of screening or diagnostic tests? RCT if time and resources allow; observational studies and RCTs rigorously linked for analytic validity, clinical validity, and clinical utility
- Efficacy/effectiveness (for health outcomes) of most therapies and preventive interventions? RCT
- Efficacy/effectiveness of interventions for otherwise fatal conditions? Non-randomized trials, case series
- Safety, effectiveness of incrementally modified technologies posing no known additional risk? Registries
- Safety, effectiveness of interventions in diverse populations in real-world settings? Registries, especially to complement findings of available RCTs, PCTs
- Rates of recall or procedures precipitated by false positive screening results? Cohort studies
- Complication rates from surgery, other procedures? Registries, case series
- Identification of a cause of a suspected iatrogenic (caused by a physician or therapy) disorder? Case-control studies
- Incidence of common adverse events potentially due to an intervention? RCTs, nested case-control studies, n-of-1 trial for particular patients, surveillance, registries
- Incidence of rare or delayed adverse events potentially due to an intervention? Surveillance; registries; n-of-1 trial for particular patients; large, long-term RCT if feasible
retrospective, are often used to identify risk factors for diseases, disorders, and adverse events. The accuracy of a new diagnostic test (though not its ultimate effect on health outcomes) may be determined by a cross-over study in which patients suspected of having a disease or disorder receive both the new (“index”) test and the “gold standard” test. Non-randomized trials or case series may be preferred for determining the effectiveness of interventions for otherwise fatal conditions, i.e., where little or nothing is to be gained by comparison to placebos or known ineffective treatments. Surveillance and registries are used to determine the incidence of rare or delayed adverse events that may be associated with an intervention. For incrementally modified technologies posing no known additional risk, registries may be appropriate for determining safety and effectiveness.
Although experimentation in the form of RCTs is regarded as the gold standard for deriving unbiased estimates of the causal effect of an intervention on health care outcomes, RCTs are not always necessary to reach the same convincing finding. Such instances arise when the size of the treatment effect is very large relative to the expected (well-established and predictable) prognosis of the disease and when this effect occurs quickly relative to the natural course of the disease, as may be discerned using historical controlled trials and certain well-designed case series and non-randomized cohort studies. Some examples include ether for anesthesia, insulin for diabetes, blood transfusion for severe hemorrhagic shock, penicillin for lobar pneumonia, ganciclovir for cytomegalovirus, imiglucerase for Gaucher’s disease, phototherapy for skin tuberculosis, and laser therapy for port wine stains (Glasziou 2007; Rawlins 2008).
F. Complementary Methods for Internal and External Validity
Those who conduct technology assessments should be as innovative in their evaluations as the technologies themselves ... The randomized trial is unlikely to be replaced, but it should be complemented by other designs that address questions about technology from different perspectives (Eisenberg 1999).
Given the range of impacts evaluated in HTA and its role in serving decision makers and policymakers with diverse responsibilities, HTA must consider the methodological validity and other attributes of various primary data methods. There is increasing recognition of the need for evidence generated by primary data methods with complementary attributes.
Although primary study investigators and assessors would prefer to have methods that achieve both internal and external validity, they often find that study design attributes that increase one type of validity jeopardize the other. As described above, a well-designed and conducted RCT is widely considered to be the best approach for ensuring internal validity. However, for the reasons that an RCT may have high internal validity, its external validity may be limited.
Findings of some large observational studies (e.g., from large cohort studies or registries) have external validity to the extent that they can provide insights into the types of outcomes that are experienced by different patient groups in different circumstances. However, these less rigorous designs are more subject to certain forms of bias and confounding that threaten internal validity of any observed relationship between an intervention (or other exposure) and outcomes. These studies are subject, for example, to selection bias on the part of patients, who have self-selected or otherwise influenced choice of an intervention, and investigators, who select which populations to study and compare. They are also subject to investigator detection bias. Interesting or promising findings from observational studies can generate hypotheses that can be tested using study designs with greater internal validity.
It is often not practical to conduct RCTs in all of the patient populations that might benefit from a particular intervention. Combinations of studies that, as a group, address internal validity and external validity may suffice. For example, RCTs demonstrating the safety and efficacy in a narrowly defined patient population can be complemented with continued follow-up of the original patient groups in those trials and by observational studies following more diverse groups of patients over time. These observational studies might include registries of larger numbers of more diverse patients who receive the intervention in various health care settings, studies of insurance claims data for patients with the relevant disease and intervention codes, studies using medical records, and postmarketing surveillance for adverse events in patients who received the intervention. Further, the RCT and observational data can provide inputs to computer-based simulations of the safety, effectiveness, and costs of using the intervention in various patient populations.
The methodological literature often contends that, due to their inherent lack of rigor, observational studies tend to report larger treatment effects than RCTs. However, certain well-designed observational studies can yield results that are similar to RCTs. An analysis published in 2000 that compared treatment effects reported from RCTs to those reported from observational studies for 19 treatments between 1985 and 1998 found that the estimates of treatment effects were similar for a large majority of the treatments (Benson 2000). Similarly, a comparison of the results of meta-analyses of RCTs and meta-analyses of observational studies (cohort or case control designs) for the same five clinical topics published between 1991 and 1995 found that the reported treatment effects (including point estimates and 95% confidence intervals) were similar (Concato 2000).
Similar to quality assessment tools for various types of studies, the GRACE (Good ReseArch for Comparative Effectiveness) principles were developed to evaluate the methodological quality of observational research studies of comparative effectiveness. The GRACE principles comprise a series of questions to guide the evaluation, including what belongs in a study plan, key elements for good conduct and reporting, and ways to assess the accuracy of comparative effectiveness inferences for a population of interest. Given the range of types of potentially relevant evidence and the need to weigh applicability for particular circumstances of routine care, GRACE has no scoring system (Dreyer 2010). The accompanying GRACE checklist is used to assess the quality and usefulness for decision making of observational studies of comparative effectiveness (Dreyer 2014).
G. Evidence Hierarchies
So should we assess evidence the way Michelin guides assess hotels and restaurants? (Glasziou 2004).
Researchers often use evidence hierarchies or other frameworks to portray the relative quality of various study designs for the purposes of evaluating single studies as well as a body of evidence comprising multiple studies. An example of a basic evidence hierarchy is:
- Systematic reviews and meta-analyses of RCTs
- Randomized controlled trials (RCTs)
- Non-randomized controlled trials
- Prospective observational studies
- Retrospective observational studies
- Expert opinion
In this instance, as is common in such hierarchies, the top item is a systematic review of RCTs, an integrative method that pools data or results from multiple single studies. (Hierarchies for single primary data studies typically have RCTs at the top.) Also, the bottom item, expert opinion, does not comprise evidence as such, though it may reflect the judgment of one or more people drawing on their perceptions of scientific evidence, personal experience, and other subjective input. There are many versions of such hierarchies, including some with more extensive levels/breakdowns.
Hierarchies cannot, moreover, accommodate evidence that relies on combining the results from RCTs and observational studies (Rawlins 2008).
As noted earlier in this chapter, although the general type or name of a study design (e.g., RCT, prospective cohort study, case series) conveys certain attributes about the quality of a study, the study design name itself is not a good proxy for study quality. One of the weaknesses of these conventional one-dimensional evidence hierarchies is that, while they tend to reflect internal validity, they do not generally reflect external validity of the evidence to more diverse patients and care settings. Depending on the intended use of the findings of a single study or of a body of evidence, an assessment of internal validity may be insufficient. Such hierarchies do not lend themselves to characterizing the quality of a body of diverse, complementary evidence that may yield fuller understanding about how well an intervention works across a heterogeneous population in different real-world circumstances. Box III-12 lists these and other limitations of conventional evidence hierarchies.
Box III-12. Limitations of Conventional Evidence Hierarchies
- Originally developed for pharmacological models of therapy
- Poor design and implementation of high-ranking study designs may yield less valid findings than lower-ranking, though better designed and implemented, study types
- Emphasis on experimental control, while enhancing internal validity, can jeopardize external validity
- Cannot accommodate evidence that relies on considering or combining results from multiple study designs
- Though intended to address internal validity of causal effect of an intervention on outcomes, they have been misapplied to questions about diagnostic accuracy, prognosis, or adverse events
- Number and inconsistencies among (60+) existing hierarchies suggest shortcomings, e.g.,
- ranking of meta-analyses relative to RCTs
- ranking of different observational studies
- terminology (“cohort studies,” “quasi-experimental,” etc.)
Sources: See, e.g.:
Glasziou P, et al. Assessing the quality of research. BMJ. 2004;328:39-41.
Rawlins MD. On the evidence for decisions about the use of therapeutic interventions. The Harveian Oration of 2008. London: Royal College of Physicians, 2008.
Walach H, et al. Circular instead of hierarchical: methodological principles for the evaluation of complex interventions. BMC Med Res Methodol. 2006;24;6:29.
Box III-13 shows an evidence framework from the Oxford Centre for Evidence-Based Medicine that defines five levels of evidence for each of several types of evidence questions pertaining to disease prevalence, screening tests, diagnostic accuracy, therapeutic benefits, and therapeutic harms. The lowest level of evidence for several of these evidence questions, “Mechanism-based reasoning,” refers to some plausible scientific basis, e.g., biological, chemical, or mechanical, for the impact of an intervention. Although the framework is still one-dimensional for each type of evidence question, it does allow for moving up or down a level based on study attributes other than the basic study design.
While retaining the importance of weighing the respective methodological strengths and limitations of various study designs, extending beyond rigid one-dimensional evidence hierarchies to more useful evidence appraisal (Glasziou 2004; Howick 2009; Walach 2006) recognizes that:
- Appraising evidence quality must extend beyond categorizing study designs
- Different types of research questions call for different study designs
- It is more important for ‘direct’ evidence to demonstrate that the effect size
is greater than the combined influence of plausible confounders than it is for the
study to be experimental.
- Best scientific evidence ─ for a pragmatic estimate of effectiveness and
safety ─ may derive from a complementary set of methods
- They can offset respective weaknesses/vulnerabilities
- “Triangulating” findings achieved with one method by replicating it with other
methods may provide a more powerful and comprehensive approach than the prevailing
RCT approach
- Systematic reviews are necessary, no matter the research type
Box III-13. Oxford Centre for Evidence-Based Medicine 2011 Levels of Evidence
Table 1 of 2. You can view the complete table in its PDF format by going
to http://www.cebm.net/wp-content/uploads/2014/06/CEBM-Levels-of-Evidence-2.1.pdf.
You can also view an image of the table.
| Question |
Step1 (Level1*) |
Step2 (Level2*) |
Step3 (Level3*) |
|---|---|---|---|
| How common is the problem? | Local and current random sample surveys (or censuses) | Systematic review of surveys that allow matching to local circumstances** | Local non-random sample** |
| Is this diagnostic or monitoring test accurate? (Diagnosis) | Systematic review of cross sectional studies with consistently applied reference standard and blinding | Individual cross sectional studies with consistently applied reference standard and blinding | Non-consecutive studies, or studies without consistently applied references tandards** |
| What will happen if we do not add a therapy? (Prognosis) | Systematic review of inception cohort studies | Inception cohort studies | Cohort study or control arm of randomized trial* |
| Does this intervention help? (Treatment Benefits) | Systematic review of randomized trials or n-of-1 trials | Randomized trial or observational study with dramatic effect | Non-randomized controlled cohort/follow-upstudy** |
| What are the COMMON harms?(Treatment Harms) | Systematic review of randomized trials, systematic review of nested case-controlstudies, n- of 1 trial with the patient you are raising the question about, or observational study with dramatic effect | Individual randomized trial or (exceptionally) observational study with dramatic effect | Non-randomized controlled cohort/follow-upstudy (post-marketing surveillance) provided there are sufficient numbers to rule out a common harm. (For long-term harms the duration of follow-up must be sufficient.)** |
| What are the RARE harms?(Treatment Harms) | Systematic review of randomized trials or n-of-1trial | Randomized trial or (exceptionally observational study with dramatic effect | |
| Is this (early detection)test worthwhile?(Screening) | Systematic review of randomized trials | Randomized trial | Non-randomized controlled cohort/follow-upstudy** |
Table 2 of 2. You can view the complete table in its PDF format by going
to http://www.cebm.net/wp-content/uploads/2014/06/CEBM-Levels-of-Evidence-2.1.pdf.
You can also view an image of the table.
| Question | Step4 (Level4*) | Step5(Level5) |
|---|---|---|
| How common is the problem? | Case-series** | n/a |
| Is this diagnostic or monitoring test accurate? (Diagnosis) | Case-control studies, or “poor or non-independent reference standard** | Mechanism-based reasoning |
| What will happen if we do not add a therapy? (Prognosis) | Case-series or case-control studies, or poor quality prognostic cohort study** | n/a |
| Does this intervention help? (Treatment Benefits) | Case-series, case-controlstudies, or historically controlled studies** | Mechanism-based reasoning |
| What are the COMMON harms?(Treatment Harms) | Case-series,case-control, or historically controlled studies** | Mechanism-based reasoning |
| What are the RARE harms?(Treatment Harms) | ||
| Is this (early detection)test worthwhile?(Screening) | Case-series,case-control, or historically controlled studies** | Mechanism-based reasoning |
*Level may be graded down on the basis ofstudy quality, imprecision, indirectness (study PICO does not match questions PICO), because of inconsistency between studies, or because the absolute effect size is very small; Level may be graded up if there is a large or very large effect size.
* *As always, a systematic review is generally better than an individual study.
Source: OCEBM Levels of Evidence Working Group. The Oxford 2011 Levels of Evidence. Oxford Centre for Evidence-Based Medicine. http://www.cebm.net/index.aspx?o=5653
H. Alternative and Emerging Study Designs Relevant to HTA
Primary data collection methods are evolving in ways that affect the body of evidence used in HTA. Of great significance is the recognition that clinical trials conducted for biomedical research or to gain market approval or clearance by regulatory agencies do not necessarily address the needs of decision makers or policymakers.
Comparative effectiveness research (CER) reflects the demand for real-world evidence to support practical decisions. It emphasizes evidence from direct (“head-to-head”) comparisons, effectiveness in real-world health care settings, health care outcomes (as opposed to surrogate or other intermediate endpoints), and ability to identify different treatment effects in patient subgroups. As traditional RCTs typically do not address this set of attributes, CER can draw on a variety of complementary study designs and analytical methods. Other important trends in support of CER are the gradual increase in use of electronic health records and more powerful computing and related health information technology, which enable more rapid and sophisticated analyses, especially of observational data. The demand for evidence on potentially different treatment effects in patient subgroups calls for study designs, whether in clinical trials or observational studies, that can efficiently discern such differences. Another powerful factor influencing primary data collection is the steeply increasing costs of conducting clinical trials, particularly of RCTs for new drugs, biologics, and medical devices; this focuses attention on study designs that require fewer patients, streamline data collection, and are of shorter duration.
Investigators continue to make progress in combining some of the desirable attributes of RCTs and observational studies. Some of the newer or still evolving clinical trial designs include: large simple trials, pragmatic clinical trials, cluster trials, adaptive trials, Bayesian trials, enrichment trials, and clinical registry trials (Lauer 2012), as described below.
Large simple trials (LSTs) retain the methodological strengths of prospective, randomized design, but use large numbers of patients, more flexible patient entry criteria and multiple study sites to generate effectiveness data and improve external validity. Fewer types of data may be collected for each patient in an LST, easing participation by patients and clinicians (Buring 1994; Ellenberg 1992; Peto 1995; Yusuf 1990). Prominent examples of LSTs include the GISSI trials of thrombolytic treatment of acute myocardial infarction (AMI) (Maggioni 1990), the ISIS trials of alternative therapies for suspected AMI (Fourth International Study of Infarct Survival 1991), and the CATIE trial of therapies for schizophrenia (Stroup 2003).
Pragmatic (or practical) clinical trials (PCTs) are a related group of trial designs whose main attributes include: comparison of clinically relevant alternative interventions, a diverse population of study participants, participants recruited from heterogeneous practice settings, and data collection on a broad range of health outcomes. PCTs require that clinical and health policy decision makers become more involved in priority setting, research design, funding, and other aspects of clinical research (Tunis 2003). Some LSTs are also PCTs.
Cluster randomized trials involve randomized assignment of interventions at the level of natural groups or organizations rather than at the level of patients or other individuals. That is, sets of clinics, hospitals, nursing homes, schools, communities, or geographic regions are randomized to receive interventions or comparators. Such designs are used when it is not feasible to randomize individuals or when an intervention is designed to be delivered at a group or social level, such as a workplace-based smoking cessation campaign or a health care financing mechanism. These are also known as “group,” “place,” or “community” randomized trials (Eldridge 2008).
Adaptive clinical trials use accumulating data to determine how to modify the design of ongoing trials according to a pre-specified plan. Intended to increase the quality, speed, and efficiency of trials, adaptive trials typically involve interim analyses, changes to sample size, changes in randomization to treatment arms and control groups, and changes in dosage or regimen of a drug or other technology (FDA Adaptive Design 2010; van der Graaf 2012).
A current example of an adaptive clinical trial is the I-SPY 2 (Investigation of Serial Studies to Predict Your Therapeutic Response with Imaging and Molecular Analysis 2), which is investigating multiple drug combinations and accompanying biomarkers for treating locally advanced breast cancer. In this adaptive trial, investigators calculate the probability that each newly enrolled patient will respond to a particular investigational drug combination based on how previous patients in the trial with similar genetic “signatures” (i.e., set of genetic markers) in their tumors have responded. Each new patient is then assigned to the indicated treatment regimen, accordingly, with an 80% chance of receiving standard chemotherapy plus an investigational drug and a 20% chance of receiving standard chemotherapy alone (Barker 2009; Printz 2013).
Bayesian clinical trials are a form of adaptive trials that rely on principles of Bayesian statistics. Rather than waiting until full enrollment and completion of follow-up for all enrolled patients, a Bayesian trial allows for assessment of results during the course of the trial and modifying its design to arrive at results more efficiently. Such midcourse modifications may include, e.g., changing the ratio of randomization to treatment arms (e.g., two patients randomized to the investigational group for every one patient randomized to the control group) to favor what appear to be more effective therapies, adding or eliminating treatment arms, changing enrollee characteristics to focus on patient subgroups that appear to be better responders, changing hypotheses from non-inferiority to superiority or vice-versa, and slowing or stopping patient accrual as certainty increases about treatment effects. These trial modifications also can accumulate and make use of information about relationships between biomarkers and patient outcomes (e.g., for enrichment, as described below). These designs enable more efficient allocation of patients to treatment arms, with the potential for smaller trials and for patients to receive better treatment (Berry 2006). Recent advances in computational algorithms and high-speed computing enable the calculations required for the complex design and simulations involved in planning and conducting Bayesian trials (FDA Guidance for the Use of Bayesian 2010; Lee 2012).
Enrichment refers to techniques of identifying patients for enrollment in clinical trials based on prospective use of patient attributes that are intended to increase the likelihood of detecting a treatment effect (if one truly exists) compared to an unselected population. Such techniques can decrease the number of patients needed to enroll in a trial; further, they can decrease patient heterogeneity of response, select for patients more likely to experience a disease-related trial endpoint, or select for patients (based on a known predictive biomarker) more likely to respond to a treatment (intended to result in a larger effect size). In adaptive enrichment of clinical trials, investigators seek to discern predictive markers during the course of a trial and apply these to enrich subsequent patient enrollment in the trial (FDA 2012). While these techniques improve the likelihood of discerning treatment effects in highly-selected patient groups, the findings of such trials may lack external validity to more heterogeneous patients. In one form of enrichment, the randomized-withdrawal trial, patients who respond favorably to an investigational intervention are then randomized to continue receiving that intervention or placebo. The study endpoints are return of symptoms or the ability to continue participation in the trial. The patients receiving the investigational intervention continue to do so only if they respond favorably, while those receiving placebo continue to do only until their symptoms return. This trial design is intended to minimize the time that patients receive placebo (IOM Committee on Strategies for Small-Number-Participant Clinical Research Trials 2001; Temple 1996).
Clinical registry trials are a type of multicenter trial design using existing online registries as an efficient platform to conduct patient assignment to treatment and control groups, maintain case records, and conduct follow-up. Trials of this type that also randomize patient assignment to treatment and control groups are randomized clinical registry trials (Ferguson 2003; Fröbert 2010).
N-of-1 trials are clinical trials in which a single patient is the total population for the trial and in which a sequence of experimental and control interventions are allocated to the patient (i.e., a multiple crossover study conducted in a single patient). A trial in which random allocation is used to determine the sequence of interventions is given to a patient is an N-of-1 RCT. N-of-1 trials are used to determine treatment effects in individuals, and sets of these trials can be used to estimate heterogeneity of treatment effects across a population (Gabler 2011).
Patient preference trials are intended to account for patient preferences in the design of RCTs, including their ability to discern the impact of patient preference on health outcomes. Among the challenges to patient enrollment and participation in traditional RCTs are that some patients who have a strong preference for a particular treatment may decline to proceed with the trial or drop out early if they are not assigned to their preferred treatment. Also, these patients may experience or report worse or better outcomes due to their expectations or perceptions of the effects of assignment to their non-preferred or preferred treatment groups. Any of these actions may bias the results of the trial. Patient preference trials enable patients to express their preferred treatment prior to enrolling in an RCT. In some of these trials, the patients with a strong preference, e.g., for a new treatment or usual care, are assigned to a parallel group receiving their preferred intervention. The patients who are indifferent to receiving the new treatment or usual care are randomized into one group or another. Outcomes for the parallel, non-randomized groups (new intervention and usual care) are analyzed apart from the outcomes for the randomized groups.
In addition to enabling patients with strong preferences to receive their preferred treatment and providing for comparison of randomized groups of patients who expressed no strong preference, these trials may provide some insights about the relative impact on outcomes of receiving one’s preferred treatment. However, this design is subject to selection bias, as there may be systematic differences in prognostic factors and other attributes between patients with a strong preference for the new treatment and patients with strong preferences for usual care. Selection bias can also affect the indifferent patients who are randomized, as there may be systematic differences in prognostic factors and other attributes between indifferent patients and the general population, thereby diminishing the external validity of the findings. To the extent that patients with preferences are not randomized, the time and cost required to enroll a sufficient number of patients for the RCT to achieve statistical power will be greater. Patient preference trials have alternative designs, e.g., partially randomized preference trials and fully randomized preference trials. In the fully randomized preference design, patient preferences are recorded prior to the RCT, but all patients then randomized regardless of their preference. In that design, subgroup analyses enable determining whether receiving one’s preferred treatment has any impact on treatment adherence, drop-outs, and outcomes (Howard 2006; Mills 2011; Preference Collaborative Review Group 2008; Silverman 1996; Torgerson 1998).
I. Collecting New Primary Data
It is beyond the scope of this document to describe the planning, design, and conduct of clinical trials, observational studies, and other investigations for collecting new primary data. There is a large and evolving literature on these subjects (Friedman 2010; Piantadosi 2005; Spilker 1991). Also, there is a literature on priority setting and efficient resource allocation for clinical trials, and cost-effective design of clinical trials (Antman 2012; Chilcott 2003; Claxton 1996; Detsky 1990; FDA Adaptive Design 2010).
As noted above, the process of compiling evidence for an assessment may call attention to the need for new primary data. An assessment program may determine that existing evidence is insufficient for informing the desired policy needs, and that new studies are needed to generate data for particular aspects of the assessment. Once available, the new data can be interpreted and incorporated into the existing body of evidence.
In the US, major units of the National Institutes of Health (NIH) such as the National Cancer Institute (NCI); the National Heart, Lung, and Blood Institute (NHLBI); and the National Institute of Allergy and Infectious Diseases (NIAID) sponsor and conduct biomedical research, including clinical trials. The Department of Veterans Affairs (VA) Cooperative Studies Program is responsible for the planning and conduct of large multicenter clinical trials and epidemiological studies within the VA. This program also works with the VA Health Economics Resource Center to perform economic analyses as part of its clinical trials. The Food and Drug Administration (FDA) does not typically conduct primary studies related to the marketing of new drugs and devices; rather, it reviews primary data from studies sponsored or conducted by the companies that make these technologies. The FDA also maintains postmarketing surveillance programs, including the FDA Adverse Event Reporting System on adverse events and medication error reports for drug and therapeutic biologic products, and the MedWatch program, in which physicians and other health professionals and the public voluntarily report serious reactions and other problems with drugs, devices, and other medical products.
In the US, the Patient-Centered Outcomes Research Institute (PCORI) was established as an independent research institute by Congress in the Patient Protection and Affordable Care Act of 2010. PCORI conducts CER and related research that is guided by patients, caregivers and the broader health care community. PCORI’s five national research priorities are: assessment of prevention, diagnosis, and treatment options; improving health care systems; enhancing communication and dissemination of evidence; addressing disparities in health and health care; and improving CER methods and data infrastructure. PCORI devotes more than 60% of its research budget to CER, including for pragmatic clinical trials, large simple trials, and large observational studies, with the balance allocated to infrastructure, methods, and communication and dissemination research (Selby 2014).
Third-party payers generally do not sponsor clinical trials. However, they have long supported clinical trials of new technologies indirectly by paying for care associated with trials of those technologies, or by paying unintentionally for non-covered new procedures that were coded as covered procedures. As noted above, payers provide various forms of conditional coverage, such as coverage with evidence development (CED), for certain investigational technologies in selected settings to compile evidence that can be used to make more informed coverage decisions. Two main types of CED are “only in research,” in which coverage of a technology is provided only for patients with specified clinical indications in the payer’s beneficiary population who are enrolled in a clinical trial of that technology, and “only with research,” in which coverage of a technology is provided for all of the patients with specified clinical indications if a subset of those patients is enrolled in a clinical trial of that technology.
An early example of CED was the multicenter RCT of lung-volume reduction surgery, the National Emphysema Treatment Trial (NETT) conducted in the US, funded by the NHLBI and the Centers for Medicare and Medicaid Services (CMS, which administers the US Medicare program) (Fishman 2003; Ramsey 2003). In another form of conditional coverage known as conditional treatment continuation, payment is provided only as long as patients meet short-term treatment goals such as lowered blood cholesterol or cancer tumor response. In performance-linked reimbursement (or “pay-for-performance”), payment for a technology is linked to data demonstrating achievement of pre-specified clinical outcomes in practice; this includes schemes in which a manufacturer must provide rebates, refunds, or price adjustments to payers if their products do not achieve certain patient outcomes (Carlson 2010). Findings about the impact of conditional coverage, performance-linked reimbursement, and related efforts on coverage policies, patient outcomes, and costs are still emerging (de Bruin 2011).
Payers and researchers often analyze data from claims, electronic health records, registries, and surveys to determine comparative effectiveness of interventions, develop coverage policies, or determine provider compliance with coverage policies. These analyses increasingly involve efforts to link claims and other administrative sources to electronic health records and other clinical sources (Croghan 2010; de Souza 2012).
The ability of most assessment programs to undertake new primary data collection, particularly clinical trials, is limited by such factors as programs’ remit (which may not include sponsoring primary data collection), financial constraints, time constraints, and other aspects of the roles or missions of the programs. An HTA program may decide not to undertake and assessment if insufficient data are available. Whether or not an assessment involves collection of new primary data, the assessment reports should note what new primary studies should be undertaken to address gaps in the current body of evidence, or to meet anticipated assessment needs.
References for Chapter III
Antman EM, Harrington RA. Transforming clinical trials in cardiovascular disease: mission critical for health and economic well-being. JAMA. 2012;308(17):1743-4. PubMed
Atkins D, Best D, Briss PA, Eccles M, et al., GRADE Working Group. Grading quality of evidence and strength of recommendations. BMJ. 2004;328(7454):1490. PubMed | PMC free article.
Atkins D, Chang S, Gartlehner G, Buckley DI, et al. Chapter 6. Assessing the Applicability of Studies When Comparing Medical Interventions. In: Methods Guide for Effectiveness and Comparative Effectiveness Reviews. AHRQ Publication No. 10(13)-EHC063-EF. Rockville, MD: Agency for Healthcare Research and Quality. September 2013. Accessed Nov. 1, 2013 at: //effectivehealthcare.ahrq.gov/ehc/products/60/318/CER-methods-guide-130916.pdf.
Barker AD, Sigman CC, Kelloff GJ, Hylton NM, et al. I-SPY 2: an adaptive breast cancer trial design in the setting of neoadjuvant chemotherapy. Clin Pharmacol Ther. 2009;86(1):97-100. PubMed.
Benson K, Hartz AJ. A comparison of observation studies and randomized, controlled trials. N Engl J Med. 2000;342(25):1878-86. PubMed | Publisher free article.
Berry DA. Bayesian clinical trials. Nat Rev Drug Discov. 2006;5(1):27-36. PubMed.
Boer GJ, Widner H. Clinical neurotransplantation: core assessment protocol rather than sham surgery as control. Brain Res Bull. 2002;58(6):547-53. PubMed.
Briss PA, Zaza S, Pappaioanou M, Fielding J, et al. Developing an evidence-based Guide to Community Preventive Services. Am J Prev Med 2000;18(1S):35-43. PubMed.
Buring JE, Jonas MA, Hennekens CH. Large and simple randomized trials. In Tools for Evaluating Health Technologies: Five Background Papers. US Congress, Office of Technology Assessment, 1995;67-91. BP-H-142. Washington, DC: US Government Printing Office; 1994. Accessed Nov. 1, 2013 at: http://ota-cdn.fas.org/reports/9440.pdf.
Button KS, Ioannidis JP, Mokrysz C, Nosek BA, et al. Power failure: why small sample size undermines the reliability of neuroscience. Nat Rev Neurosci. 2013;14(5):365-76. PubMed
Campbell MK, Entwistle VA, Cuthbertson BH, Skea ZC, et al.; KORAL study group. Developing a placebo-controlled trial in surgery: issues of design, acceptability and feasibility. Trials. 2011;12:50. PubMed | PMC free article.
Carlson JJ, Sullivan SD, Garrison LP, Neumann PJ, Veenstra DL. Linking payment to health outcomes: a taxonomy and examination of performance-based reimbursement schemes between healthcare payers and manufacturers. Health Policy. 2010;96(3):179-90.PubMed
Chilcott J, Brennan A, Booth A, Karnon J, Tappenden P. The role of modelling in prioritising and planning clinical trials. Health Technol Assess. 2003;7(23):iii,1-125. PubMed | Publisher free article.
Claxton K, Posnett J. An economic approach to clinical trial design and research priority-setting. Health Econ. 1996;5(6):513-24. PubMed.
ClinicalTrials.gov. FDAAA 801 Requirements. December 2012. Accessed Aug. 1, 2013 at: //clinicaltrials.gov/ct2/manage-recs/fdaaa#WhichTrialsMustBeRegistered.
Concato J, Shah N, Horwitz RI. Randomized, controlled trials, observational studies, and the hierarchy of research designs. N Engl J Med. 2000;342:1887-92. PubMed | PMC free article.
Croghan TW, Esposito D, Daniel G, Wahl P, Stoto MA. Using medical records to supplement a claims-based comparative effectiveness analysis of antidepressants. Pharmacoepidemiol Drug Saf. 2010;19(8):814-8. PubMed.
de Bruin SR, Baan CA, Struijs JN. Pay-for-performance in disease management: a systematic review of the literature. BMC Health Serv Res. 2011;11:272. PubMed | PMC free article.
de Souza JA, Polite B, Perkins M, Meropol NJ, et al. Unsupported off-label chemotherapy in metastatic colon cancer. BMC Health Serv Res. 2012;12:481. PubMed | PMC free article.
Detsky AS. Using cost-effectiveness analysis to improve the efficiency of allocating funds to clinical trials. Stat Med. 1990;9(1-2):173-84. PubMed.
DiMasi JA, Hansen RW, Grabowski HG. The price of innovation: new estimates of drug development costs. J Health Econ. 2003;22(2):151–85. PubMed.
Djulbegovic B. The paradox of equipoise: the principle that drives and limits therapeutic discoveries in clinical research. Cancer Control. 2009;16(4):342-7. PubMed | PMC free article.
Dreyer NA, Schneeweiss S, McNeil BJ, Berger ML, et al. GRACE principles: recognizing high-quality observational studies of comparative effectiveness. Am J Manag Care. 2010;16(6):467-71. PubMed | Publisher free article.
Dreyer NA, Velentgas P, Westrich K, Dubois R. The GRACE Checklist for Rating the Quality of Observational Studies of Comparative Effectiveness: A Tale of Hope and Caution. J Manag Care Pharm. 2014;20(3):301-8. PubMed.
Eisenberg JM. Ten lessons for evidence-based technology assessment. JAMA. 1999; 282(19):1865-9. PubMed.
Eldridge S, Ashby D, Bennett C, et al. Internal and external validity of cluster randomised trials: systematic review of recent trials. BMJ. 2008;336(7649):876-80. PubMed | PMC free article.
Ellenberg SS. Do large, simple trials have a place in the evaluation of AIDS therapies? Oncology. 1992;6(4):55-9,63. PubMed.
Enck P, Bingel U, Schedlowski M, Rief W. The placebo response in medicine: minimize, maximize or personalize? Nat Rev Drug Discov. 2013;12(3):191-204. PubMed.
Ferguson TB Jr, Peterson ED, Coombs LP, Eiken MC, et al. Use of continuous quality improvement to increase use of process measures in patients undergoing coronary artery bypass graft surgery: A randomized controlled trial. JAMA. 2003;290(1):49-56. PubMed.
Fishman A, Martinez F, Naunheim K, et al; National Emphysema Treatment Trial Research Group. A randomized trial comparing lung-volume-reduction surgery with medical therapy for severe emphysema. N Engl J Med. 2003 May 22;348(21):2059-73. PubMed | Publisher free article.
Food and Drug Administration. Adaptive Design Clinical Trials for Drugs and Biologics.; Draft Guidance. Center for Drug Evaluation and Research, Center for Biologics Evaluation and Research. Rockville, MD, February 2010. Accessed Nov. 1, 2013 at: //www.fda.gov/downloads/Drugs/.../Guidances/ucm201790.pdf.
Food and Drug Administration. Guidance for Industry. Enrichment Strategies for Clinical Trials to Support Approval of Human Drugs and Biological Products. Draft Guidance. Center for Drug Evaluation and Research, Center for Biologics Evaluation and Research, Center for Devices and Radiological Health. Rockville, MD, December 2012. Accessed Nov. 1, 2013 at: //www.fda.gov/downloads/Drugs/GuidanceComplianceRegulatoryInformation/Guidances/UCM332181.pdf.
Food and Drug Administration. Guidance for the Use of Bayesian Statistics in Medical Device Clinical Trials. Center for Devices and Radiological Health, Center for Biologics Evaluation and Research. Rockville, MD, February5, 2010. Accessed Nov. 1, 2013 at: //www.fda.gov/downloads/MedicalDevices/DeviceRegulationandGuidance/GuidanceDocuments/ucm071121.pdf.
Fourth International Study of Infarct Survival: protocol for a large simple study of the effects of oral mononitrate, of oral capvtopril, and of intravenous magnesium. ISIS-4 collaborative group. Am J Cardiol. 1991;68(14):87D-100D. PubMed.
Freedman B. Equipoise and the ethics of clinical research. N Engl J Med. 1987;317(3):141-5. PubMed.
Friedman LM. Furberg CD, DeMets DL. Fundamentals of Clinical Trials. (4th edition). New York: Springer, 2010.
Fries JF, Krishnan E. Equipoise, design bias, and randomized controlled trials: the elusive ethics of new drug development. Arthritis Res Ther. 2004;6(3):R250-5. PubMed | PMC free article.
Fröbert O, Lagerqvist B, Gudnason T, Thuesen L, et al. Thrombus Aspiration in ST-Elevation myocardial infarction in Scandinavia (TASTE trial). A multicenter, prospective, randomized, controlled clinical registry trial based on the Swedish angiography and angioplasty registry (SCAAR) platform. Study design and rationale. Am Heart J. 2010;160(6):1042-8. PubMed
Frost J, Okun S, Vaughan T, Heywood J, Wicks P. Patient-reported outcomes as a source of evidence in off-label prescribing: analysis of data from PatientsLikeMe. J Med Internet Res. 2011 Jan 21;13(1):e6. PubMed | PMC free article.
Gabler NB, Duan N, Vohra S, Kravitz RL. N-of-1 trials in the medical literature: a systematic review. Med Care. 2011;49(8):761-8. PubMed.
Glasziou P, Vandenbroucke J, Chalmers I. Assessing the quality of research. BMJ.2004;328(7430):39-41. PubMed | PMC free article.
Goodman S. A dirty dozen: twelve p-value misconceptions. Semin Hematol. 2008;45(3):135-40. PubMed.
Hartling L, Bond K, Harvey K, Santaguida PL, et al. Developing and Testing a Tool for the Classification of Study Designs in Systematic Reviews of Interventions and Exposures. Agency for Healthcare Research and Quality; December 2010. Methods Research Report. AHRQ Publication No. 11-EHC-007. Bookshelf free publication.
Higgins JP, Altman DG, Gøtzsche PC, Jüni P, et al.; Cochrane Bias Methods Group; Cochrane Statistical Methods Group. The Cochrane Collaboration's tool for assessing risk of bias in randomized trials. BMJ. 2011;343:d5928. PubMed | PMC free article
Higgins JPT, Altman DG, Sterne, JAC, eds. Chapter 8: Assessing risk of bias in included studies. In: Higgins JPT, Green S, eds. Cochrane Handbook for Systematic Reviews of Interventions. Version 5.1.0 [updated March 2011]. The Cochrane Collaboration, 2011. Publisher free publication.
Horng S, Miller FG. Ethical framework for the use of sham procedures in clinical trials. Crit Care Med. 2003;31(suppl. 3):S126-30. PubMed.
Howard L, Thornicroft G. Patient preference randomised controlled trials in mental health research. Br J Psychiatry. 2006;188:303-4. PubMed | Publisher free article.
Howick J, Glasziou P, Aronson JK. The evolution of evidence hierarchies: what can Bradford Hill's 'guidelines for causation' contribute? J R Soc Med. 2009;102(5):186-94. PubMed | PMC free article.
Huser V, Cimino JJ. Evaluating adherence to the International Committee of Medical Journal Editors' policy of mandatory, timely clinical trial registration. J Am Med Inform Assoc. 2013;20(e1):e169-74. PubMed | PMC free article.
ICMJE (International Committee of Medical Journal Editors). Clinical Trial Registration. 2014. Accessed Oct. 23, 2014 at: http://www.icmje.org/recommendations/browse/publishing-and-editorial-issues/clinical-trial-registration.html.
Institute of Medicine. Committee on Strategies for Small-Number-Participant Clinical Research Trials. Small Clinical Trials: Issues and Challenges. Washington, DC: National Academies Press; 2001. Publisher free book.
Ioannidis JP, Khoury MJ. Are randomized trials obsolete or more important than ever in the genomic era? Genome Med. 2013;5(4):32. PubMed | PMC free article.
Jadad AR, Moore RA, Carrol D, et al. Assessing the quality of reports of randomized clinical trials: Is blinding necessary? Control Clin Trials. 1996;17:1-12. PubMed.
Lauer MS. Commentary: How the debate about comparative effectiveness research should impact the future of clinical trials. Stat Med. 2012;31(25):3051-3. PubMed.
Lee JJ, Chu CT. Bayesian clinical trials in action. Stat Med. 2012;31(25):2955-72. PubMed | PMC free article.
Maggioni AP, Franzosi MG, Fresco C, et al. GISSI trials in acute myocardial infarction. Rationale, design, and results. Chest. 1990;97(4 Suppl):146S-150S. PubMed.
Mant D. Can randomized trials inform clinical decisions about individual patients? Lancet. 1999;353:743–6. PubMed.
Mills N, Donovan JL, Wade J, Hamdy FC, et al. Exploring treatment preferences facilitated recruitment to randomized controlled trials. J Clin Epidemiol. 2011;64(10):1127-36. PubMed | PMC free article.
Morgan S, Grootendorst P, Lexchin J, Cunningham C, Greyson D. The cost of drug development: a systematic review. Health Policy. 2011;100(1):4-17. PubMed.
Moseley JB, O’Malley K, Petersen NJ, et al. A controlled trial of arthroscopic surgery for osteoarthritis of the knee. N Engl J Med. 2002;347(2):81-8. PubMed | Publisher Free Article.
Nakamura C, Bromberg M, Bhargava S, Wicks P, Zeng-Treitler Q. Mining online social network data for biomedical research: a comparison of clinicians' and patients' perceptions about amyotrophic lateral sclerosis treatments. J Med Internet Res. 2012;14(3):e90. PubMed | PMC free article.
OCEBM Levels of Evidence Working Group. The Oxford 2011 Levels of Evidence. Oxford Centre for Evidence-Based Medicine. Publisher free article.
Olivo SA, Macedo LG, Gadotti IC, Fuentes J, et al. Scales to assess the quality of randomized controlled trials: a systematic review. Phys Ther. 2008;88(2):156-75. PubMed | Publisher free article.
Peto R, Collins R, Gray R. Large-scale randomized evidence: large, simple trials and overviews of trials. J Clin Epidemiol. 1995;48(1):23-40. PubMed.
Piantadosi S. Clinical Trials: A Methodological Perspective (2nd edition). New York: Wiley, 2005.
Preference Collaborative Review Group. Patients' preferences within randomised trials: systematic review and patient level meta-analysis. BMJ. 2008;337:a1864. PubMed | PMC free article.
Printz C. I-SPY 2 may change how clinical trials are conducted: Researchers aim to accelerate approvals of cancer drugs. Cancer. 2013;119(11):1925-7. PubMed.
Ramsey SD, Berry K, Etzioni R, et al., National Emphysema Treatment Trial Research Group. Cost effectiveness of lung-volume-reduction surgery for patients with severe emphysema. N Engl J Med. 2003;348(21):2092-102. PubMed | Publisher free article.
Rawlins MD. De Testimonio: On the evidence for decisions about the use of therapeutic interventions. The Harveian Oration of 2008. London: Royal College of Physicians, 2008. PubMed.
Rothman KJ, Michels KB. The continuing unethical use of placebo controls. N Engl J Med. 1994;331(6):394-7. PubMed.
Roundtree AK, Kallen MA, Lopez-Olivo MA, Kimmel B, et al. Poor reporting of search strategy and conflict of interest in over 250 narrative and systematic reviews of two biologic agents in arthritis: a systematic review. J Clin Epidemiol. 2009;62(2):128-37. PubMed.
Roy ASA. Stifling New Cures: The True Cost of Lengthy Clinical Drug Trials. Project FDA Report 5. New York: Manhattan Institute for Policy Research; April 2012. Publisher free article.
Selby JV, Lipstein SH. PCORI at 3 years--progress, lessons, and plans. N Engl J Med. 2014;370(7):592-5. PubMed | Publisher free article.
Silverman WA, Altman DG. Patients' preferences and randomised trials. Lancet. 1996;347(8995):171-4. PubMed.
Spilker B. Guide to Clinical Trials. New York, NY: Raven Press, 1991.
Stone GW, Teirstein PS, Rubenstein R, et al. A prospective, multicenter, randomized trial of percutaneous transmyocardial laser revascularization in patients with nonrecanalizable chronic total occlusions. J Am Coll Cardiol. 2002;39(10):1581-7. PubMed | Publisher free article.
Stroup TS, McEvoy JP, Swartz MS, et al. The National Institute of Mental Health Clinical Antipsychotic Trials of Intervention Effectiveness (CATIE) project: schizophrenia trial design and protocol development. Schizophr Bull. 2003;29(1):15-31. PubMed | Publisher free article.
Temple R. Problems in interpreting active control equivalence trials. Account Res. 1996;4(3-4):267-75. PubMed.
Torgerson DJ, Sibbald B. Understanding controlled trials. What is a patient preference trial? BMJ. 1998;316(7128):360. PubMed | PMC free article.
Tunis SR, Stryer DB, Clancy CM. Practical clinical trials: increasing the value of clinical research for decision making in clinical and health policy. JAMA. 2003;290(12):1624-32. PubMed.
US Preventive Services Task Force Procedure Manual. December, 2015. Accessed June 7, 2016 at:http://www.uspreventiveservicestaskforce.org/Home/GetFile/6/7/procedure-manual_2016/pdf .
van der Graaf R, Roes KC, van Delden JJ. Adaptive trials in clinical research: scientific and ethical issues to consider. JAMA. 2012;307(22):2379-80. PubMed.
Varmus H, Satcher D. Ethical complexities of conducting research in developing countries. N Engl J Med. 1997;337(14):1003-5. PubMed.
Veatch RM. The irrelevance of equipoise. J Med Philos. 2007;32(2):167-83. PubMed.
Viswanathan M, Ansari MT, Berkman ND, Chang S, et al. Chapter 9. Assessing the risk of bias of individual studies in systematic reviews of health care interventions. In: Methods Guide for Effectiveness and Comparative Effectiveness Reviews. AHRQ Publication No. 10(14)-EHC063-EF. Rockville, MD: Agency for Healthcare Research and Quality. January 2014. Accessed Feb. 1, 2014 at: //www.effectivehealthcare.ahrq.gov/ehc/products/60/318/CER-Methods-Guide-140109.pdf.
Walach H, Falkenberg T, Fønnebø V, Lewith G, Jonas WB. Circular instead of hierarchical: methodological principles for the evaluation of complex interventions. BMC Med Res Methodol. 2006;24;6:29. PubMed | PMC free article.
Wang R, Lagakos WE, Ware JH, Hunter DJ, Drazen JM. Statistics in medicine: reporting of subgroup analyses in clinical trials. N Engl J Med 2007;357(21):2189-94. PubMed | Publisher free article.
Whiting PF, Rutjes AW, Westwood ME, Mallett S, et al.; QUADAS-2 Group. QUADAS-2: a revised tool for the quality assessment of diagnostic accuracy studies. Ann Intern Med. 2011;155(8):529-36. PubMed.
Yusuf S, Held P, Teo KK, Toretsky ER. Selection of patients for randomized controlled trials: implications of wide or narrow eligibility criteria. Stat Med. 1990;9(1-2):73-83. PubMed.
Zarin DA, Tse T, Williams RJ, Califf RM, Ide NC. The ClinicalTrials.gov results database--update and key issues. N Engl J Med. 2011;364(9):852-60. PubMed | PMC free article.
IV. Integrative Methods
Integrative methods involve combining existing data from various sources to synthesize evidence, especially when no single definitive primary study exists. This section covers systematic reviews, meta-analysis, and guidelines for reporting research.
- A. Systematic Literature Reviews
- B. Working with Best Evidence
- C. Meta-Analysis
- D. Guidelines for Reporting Primary and Secondary Research
- E. Modeling
- F. Assessing the Quality of a Body of Evidence
- G. Consensus Development
- References for Chapter IV
Integrative methods (or secondary or synthesis methods) involve combining data or information from existing sources, including from primary data studies. These can range from quantitative, structured approaches such as meta-analyses or systematic literature reviews to informal, unstructured literature reviews.
Having considered the merits of individual studies, an assessment group must then integrate, synthesize, or consolidate the available relevant findings. For many topics in HTA, there is no single definitive primary study, e.g., that settles whether one technology is better than another for a particular clinical situation. Even where definitive primary studies exist, findings from them may be combined or considered in broader social and economic contexts in order to help inform policies.
- Systematic literature review
- Meta-analysis
- Modeling (e.g., decision trees, state-transition models, infectious disease models)
- Group judgment (“consensus development”)
- Unstructured literature review
- Expert opinion
Certain biases inherent in traditional means of consolidating literature (i.e., non-quantitative or unstructured literature reviews and editorials) are well recognized, and greater emphasis is given to more structured, quantified, and better-documented methods. The body of knowledge concerning how to strengthen and apply these integrative methods has grown substantially. Considerable work has been done to improve the validity of decision analysis and meta-analysis in particular over the last 25 years (see, e.g., Eckman 1992; Eddy 1992; Lau 1992). This was augmented by consensus-building approaches of the NIH Consensus Development Program, the panels on appropriateness of selected medical and surgical procedures conducted by the RAND Corporation, the clinical practice guidelines activities sponsored until the mid-1990s by the predecessor agency to AHRQ (the Agency for Health Care Policy and Research), and others.
Systematic reviews, meta-analyses, and certain types of modeling consolidate findings of existing relevant research in order to resolve inconsistencies or ambiguities among existing studies and yield findings that may not have been apparent or significant in individual studies. These study designs use predetermined criteria and systematic processes to search for, screen for inclusion and exclusion, and combe the findings of existing studies.
Although systematic reviews, meta-analyses, and modeling can produce new insights from existing evidence, they do not generate new data. Well-formulated inclusion and exclusion criteria can help to diminish various sources of bias that could be introduced by the primary data studies or the selection of these studies for the integrative studies.
The applicability of the findings of integrative methods is constrained by any limitations of their component primary studies with respect to, e.g., patient age groups, comorbidities, health care settings, and selection of outcomes measures. Regardless of how rigorously a systematic review is conducted, its ability to determine the most effective intervention is limited by the scope and quality of the underlying evidence. Even studies that satisfy rigorous inclusion criteria may, as a group, reflect publication bias. Other factors may limit the external validity of the findings, such as narrowly defined study populations (e.g., with no comorbidities), inappropriate comparison therapies, insufficient duration of follow-up, and restriction to clinical settings with high levels of expertise and ancillary services that may not prevail in community practice. Often, the greatest value of a systematic review or meta-analysis is its ability to identify gaps in evidence that may be helpful in identifying the need for future primary studies.
Four major types of integrative methods, i.e., systematic literature reviews, meta-analysis, decision analysis, and consensus development, are described below.
A. Systematic Literature Reviews
A systematic literature review is a form of structured literature review that addresses one or more evidence questions (or key questions) that are formulated to be answered by analysis of evidence. Broadly, this involves:
- Objective means of searching the literature
- Applying predetermined inclusion and exclusion criteria to this literature
- Critically appraising the relevant literature
- Extraction and synthesis of data from evidence base to formulate answers to key questions
Depending on the purpose of the systematic review and the quality of the included studies, systematic reviews often include meta-analyses. A useful way to define the key questions used in a systematic review and to guide the literature search is the “PICOTS” format (see, e.g., Counsell 1997):
- Population: e.g., condition, disease severity/stage, comorbidities, risk factors, demographics
- Intervention: e.g., technology type, regimen/dosage/frequency, technique/method of administration
- Comparator: e.g., placebo, usual/standard care, active control
- Outcomes: e.g., morbidity, mortality, quality of life, adverse events
- Timing: e.g., duration/intervals of follow-up
- Setting: e.g., primary, inpatient, specialty, home care
Not all evidence questions use all of these elements; some use PICO only.
The main steps of a systematic review include the following (see, e.g., Buckley 2014; Rew 2011; Shea 2007; Sutton 1998):
- Specify purpose of the systematic review
- Specify evidence questions. Use appropriate structured format, e.g., PICOTS
- Specify review protocol that is explicit, unbiased, and reproducible, including:
- Inclusion and exclusion criteria for studies to be reviewed, including type/status of publication (e.g., peer-reviewed publication vs. grey literature)
- Bibliographic databases (and other sources, if applicable) to be searched
- Search terms/logic for each database
- Methods of review (e.g., number of independent parallel reviewers of each study)
- Intention to conduct meta-analysis (if appropriate and feasible) and specification of methods to combine/pool data
- Register or publish protocol, as appropriate
- Perform comprehensive literature search
- Document all search sources and methods
- Review search results and compare to inclusion/exclusion criteria
- Account for included and excluded studies (e.g., using a flow diagram)
- Identify and exclude duplicate studies, as appropriate
- Compile and provide lists of included studies and excluded studies (with reasons for exclusion)
- Assess potential sources of publication bias
- Systematically extract data from each included study
- Consistent with review protocol
- Include PICOTS characteristics
- Present extracted data in tabular form
- Assess quality of individual studies retrieved/reviewed
- Document quality for each study
- Account for potential conflicts of interest
- Perform meta-analysis (if specified in protocol and if methodologically feasible based on primary data characteristics)
- Assess quality (or strength) of cumulative body of evidence
- Assess risks of bias, directness or relevance of evidence (patients, interventions, outcomes, etc.) to the evidence questions, consistency of findings across available evidence, and precision in reporting results
- Assign grade to cumulative body of evidence
- Present results/findings
- Link results/findings explicitly to evidence from included studies
- Account for quality of the included studies
- Present clearly to enable critical appraisal and replication of systematic review
- Conduct sensitivity analysis of review results
- Examine the impact on review results of inclusion/exclusion criteria, publication bias, and plausible variations in assumptions and estimates of outcomes and other parameters
- Also conduct analyses (e.g., subgroup analyses and meta-regression) for better understanding of heterogeneity of effects
- Describe limitations and actual/potential conflicts of interest and biases in the process
- Account for body of included studies and the systematic review process
- Describe evidence gaps and future research agenda, as appropriate
- Disseminate (e.g., publish) results
Assessing the quality of individual studies is described in chapter III. Assessing the quality (or strength) of a cumulative body of evidence is described later in chapter IV. Dissemination of results is described in chapter VIII.
In conducting literature searches for systematic reviews, a more comprehensive and unbiased identification of relevant clinical trials and other studies (consistent with the inclusion criteria) may be realized by expanding the search beyond the major biomedical bibliographic databases such PubMed and Embase. Additional in-scope studies may be identified via specialized databases and clinical trial registries, reference lists, hand-searching of journals, conference abstracts, contacting authors and trials sponsors (e.g., life sciences companies) to find unpublished trials, and Internet search engines. The studies identified in these ways should remain subject to the quality criteria used for the systematic review. The extent to which an expanded search has an impact on the findings of the systematic review varies (Savoie 2003). Systematic reviews of particular types of technologies may use different sets of databases and synthesis approaches for particular types of technologies, such as for imaging procedures and diagnostic tests (Bayliss 2008; Whiting 2008).
One of the tools developed to assess the quality of systematic reviews, the Assessment of Multiple Systematic Reviews (AMSTAR), which was derived using nominal group technique and factor analysis of previous instruments, has the following 11 items (Shea 2007; Shea 2009):
- Was an ‘a priori’ design provided?
- Was there duplicate study selection and data extraction?
- Was a comprehensive literature search performed?
- Was the status of publication ([e.g.,] grey literature) used as an inclusion criterion?
- Was a list of studies (included and excluded) provided?
- Were the characteristics of the included studies provided?
- Was the scientific quality of the included studies assessed and documented?
- Was the scientific quality of the included studies used appropriately in formulating conclusions?
- Were the methods used to combine the findings of studies appropriate?
- Was the likelihood of publication bias assessed?
- Was the conflict of interest stated?
In addition to those for assessing methodological quality of systematic reviews, there are instruments to assess the reporting of systematic reviews and meta-analyses, including the Preferred Reporting Items of Systematic reviews and Meta-Analyses instrument (PRISMA) (Moher 2009), as shown in Box 1. Various computer software packages are available to manage references and related bibliographic information for conducting systematic reviews; examples are EndNote, Reference Manager, and RefWorks (see, e.g., Hernandez 2008), though no particular recommendation is offered here.
Box 1. PRIMSA Checklist of Items to Include When Reporting a Systematic Review
| Section/topic | # | Checklist item | Reported on page # |
| TITLE | |||
| Title | 1 | Identify the report as a systematic review, meta-analysis, or both. | |
| ABSTRACT | |||
| Structured summary | 2 | Provide a structured summary including, as applicable: background; objectives; data sources; study eligibility criteria, participants, and interventions; study appraisal and synthesis methods; results; limitations; conclusions and implications of key findings; systematic review registration number. | |
| INTRODUCTION | |||
| Rationale | 3 | Describe the rationale for the review in the context of what is already known. | |
| Objectives | 4 | Provide an explicit statement of questions being addressed with reference to participants, interventions, comparisons, outcomes, and study design (PICOS). | |
| METHODS | |||
| Protocol and registration | 5 | Indicate if a review protocol exists, if and where it can be accessed (e.g., Web address), and, if available, provide registration information including registration number. | |
| Eligibility criteria | 6 | Specify study characteristics (e.g., PICOS, length of follow-up) and report characteristics (e.g., years considered, language, publication status) used as criteria for eligibility, giving rationale. | |
| Information sources | 7 | Describe all information sources (e.g., databases with dates of coverage, contact with study authors to identify additional studies) in the search and date last searched. | |
| Search | 8 | Present full electronic search strategy for at least one database, including any limits used, such that it could be repeated. | |
| Study selection | 9 | State the process for selecting studies (i.e., screening, eligibility, included in systematic review, and, if applicable, included in the meta-analysis). | |
| Data collection process | 10 | Describe method of data extraction from reports (e.g., piloted forms, independently, in duplicate) and any processes for obtaining and confirming data from investigators. | |
| Data items | 11 | List and define all variables for which data were sought (e.g., PICOS, funding sources) and any assumptions and simplifications made. | |
| Risk of bias in individual studies | 12 | Describe methods used for assessing risk of bias of individual studies (including specification of whether this was done at the study or outcome level), and how this information is to be used in any data synthesis. | |
| Summary measures | 13 | State the principal summary measures (e.g., risk ratio, difference in means). | |
| Synthesis of results | 14 | Describe the methods of handling data and combining results of studies, if done, including measures of consistency (e.g., I2) for each meta-analysis. | |
Source: Moher D, Liberati A, Tetzlaff J, Altman DG, The PRISMA Group. Preferred Reporting Items for Systematic Reviews and Meta-Analyses: The PRISMA Statement. PLoS Med. 2009;6(7):e1000097.
Box IV-1. PRIMSA Checklist of Items to Include When Reporting a Systematic Review (cont’d)
| Section/topic | # | Checklist item | Reported on page # |
| Risk of bias across studies | 15 | Specify any assessment of risk of bias that may affect the cumulative evidence (e.g., publication bias, selective reporting within studies). | |
| Additional analyses | 16 | Describe methods of additional analyses (e.g., sensitivity or subgroup analyses, meta-regression), if done, indicating which were pre-specified. | |
| RESULTS | |||
| Study selection | 17 | Give numbers of studies screened, assessed for eligibility, and included in the review, with reasons for exclusions at each stage, ideally with a flow diagram. | |
| Study characteristics | 18 | For each study, present characteristics for which data were extracted (e.g., study size, PICOS, follow-up period) and provide the citations. | |
| Risk of bias within studies | 19 | Present data on risk of bias of each study and, if available, any outcome level assessment (see item 12). | |
| Results of individual studies | 20 | For all outcomes considered (benefits or harms), present, for each study: (a) simple summary data for each intervention group (b) effect estimates and confidence intervals, ideally with a forest plot. | |
| Synthesis of results | 21 | Present results of each meta-analysis done, including confidence intervals and measures of consistency. | |
| Risk of bias across studies | 22 | Present results of any assessment of risk of bias across studies (see Item 15). | |
| Additional analysis | 23 | Give results of additional analyses, if done (e.g., sensitivity or subgroup analyses, meta-regression [see Item 16]). | |
| DISCUSSION | |||
| Summary of evidence | 24 | Summarize the main findings including the strength of evidence for each main outcome; consider their relevance to key groups (e.g., healthcare providers, users, and policy makers). | |
| Limitations | 25 | Discuss limitations at study and outcome level (e.g., risk of bias), and at review-level (e.g., incomplete retrieval of identified research, reporting bias). | |
| Conclusions | 26 | Provide a general interpretation of the results in the context of other evidence, and implications for future research. | |
| FUNDING | |||
| Funding | 27 | Describe sources of funding for the systematic review and other support (e.g., supply of data); role of funders for the systematic review. |
Source: Moher D, Liberati A, Tetzlaff J, Altman DG, The PRISMA Group. Preferred Reporting Items for Systematic Reviews and Meta-Analyses: The PRISMA Statement. PLoS Med. 2009;6(7):e1000097.
A resource for minimizing publishing bias in systematic reviews is PROSPERO, an international database of prospectively registered systematic reviews in health and social care. The main objectives of PROSPERO are to reduce unplanned duplication of systematic reviews and provide transparency in the review process with the aim of minimizing reporting/publication bias. By providing a comprehensive listing of systematic reviews and their protocols at their inception, PROSPERO is intended to help counter publication bias by providing a permanent record of the original protocol of each systematic review, whether or not it is published. As such, comparison of this record to any reported findings of the systematic reviews can reveal any differences between the methods and outcomes of the registered protocol with those that are ultimately reported. Also, registration of reviews should diminish instances of duplication of effort. Established in 2011, PROSPERO is managed by the Centre for Reviews and Dissemination and funded by the UK National Institute for Health Research (Booth 2012).
B. Working with Best Evidence
In health care as well as other fields, there are tradeoffs between wanting to rely on the highest quality of evidence and the need to derive useful findings when evidence of the highest quality is limited or unavailable. For example:
In law, there is a principle that the same evidence that would be essential in one case might be disregarded in another because in the second case there is better evidence available…. Best-evidence synthesis extends this principle to the practice of research review. For example, if a literature contains several studies high in internal and external validity, then lower quality studies might be largely excluded from the review …. However, if a set of studies high in internal and external validity does not exist, we might cautiously examine the less well designed studies to see if there is adequate unbiased information to come to any conclusion (Slavin 1995).
A desire to base health care decisions and policies on evidence generated from study designs that are of high quality for establishing internal validity of a causal relationship should not preclude using the best evidence that is available from other study designs. First, as described in detail in chapter III, evidence of internal validity should be complemented by evidence of external validity wherever appropriate and feasible to demonstrate that a technology works in real-world practice. Second, whether for internal validity or external validity, evidence from the highest quality study designs may not be available. For purposes of helping to inform clinical decisions and health care policies, it may be impractical to cease an evidence review because of the absence of high-quality evidence. The “best evidence” may be the best available evidence, i.e., the best evidence that is currently available and relevant for the evidence questions of interest (Ogilvie 2005).
“Best evidence” is not based on a single evidence hierarchy and it is not confined to internal validity. Even where traditional high-quality evidence with internal validity does exist (e.g., based on well-designed and conducted RCTs or meta-analyses of these), complementary evidence from other study designs (e.g., practical clinical trials, observational studies using registry data) may be needed to determine external validity. Where there is little or no high-quality evidence with internal validity, it may be necessary to pursue lower quality evidence for internal validity, such as non-randomized clinical trials, trials using historical controls, case series, or various types of observational studies, while documenting potential forms of bias that might accompany such evidence.
The need to seek lower-quality evidence in the absence of high-quality evidence also depends on the nature of the health problem and evidence question(s) of interest. For example, given a serious health problem for which one or more existing technologies have been proven safe and effective based on high-quality evidence, the evidence required for a new technology should be based on high-quality evidence, as substitution of an existing proven technology by a new one with poorly established safety and uncertain effectiveness could pose unacceptable risks to patients who are experiencing good outcomes. In the instance of a rare, serious health problem for which no effective treatment exists, it may be difficult to conduct adequately powered RCTs, and lower-quality evidence suggesting a clinically significant health benefit, even with limited data on safety, may be acceptable as the best available evidence. Of course, appraising the evidence and assigning grades to any accompanying recommendations must remain objective and transparent. That is, just because an assessment must rely on the best available evidence does not necessarily mean that this evidence is high-quality (e.g., “Level I”) evidence, or that recommendations based on it will be “Strong” or of “Grade A.”
Inclusion and exclusion criteria for a systematic review should be informed by the evidence questions to be addressed as well as some knowledge about the types and amounts of evidence available, which can be determined from examining previous reviews and a preliminary literature search. To the extent that there appears to be a body of high-quality evidence with high internal and external validity, it may be unnecessary to pursue evidence of lower quality. However, in the absence of such evidence, it may be necessary to pursue lower-quality evidence (Lyles 2007; Ogilvie 2005).
C. Meta-Analysis
Meta-analysis refers to a group of statistical methods for combining (or “pooling”) the data or results of multiple studies to obtain a quantitative estimate of the overall effect of a particular technology (or other variable) on a defined outcome. This combination may produce a stronger conclusion than can be provided by any individual study (Laird 1990; Normand 1999; Thacker 1988). A meta-analyses is not the same as a systematic review, although many systematic reviews include meta-analyses, where doing so is methodologically feasible.
The purposes of meta-analysis include:
- Encourage systematic organization of evidence
- Increase statistical power for primary end points
- Increase general applicability (external validity) of findings
- Resolve uncertainty when reports disagree
- Assess the amount of variability among studies
- Provide quantitative estimates of effects (e.g., odds ratios or effect sizes)
- Identify study characteristics associated with particularly effective treatments
- Call attention to strengths and weaknesses of a body of research in a particular area
- Identify needs for new primary data collection
Meta-analysis typically is used for topics that have no definitive studies, including topics for which non-definitive studies are in some disagreement. Evidence collected for HTA often includes studies with insufficient statistical power (e.g., because of small sample sizes) to detect any true treatment effects. By combining the results of multiple studies, a meta-analysis may have sufficient statistical power to detect a true treatment effect if one exists, or at least narrow the confidence interval around the mean treatment effect.
The basic steps in meta-analysis are the following:
- Specify the problem of interest.
- Specify the criteria for inclusion and exclusion of studies (e.g., type and quality).
- Identify and acquire all studies that meet inclusion criteria.
- Classify study characteristics and findings according to, e.g.: study characteristics (patient types, practice setting, etc.), methodological characteristics (e.g., sample sizes, measurement process), primary results and type of derived summary statistics.
- Statistically combine study findings using common units (e.g., by averaging effect sizes); relate these to study characteristics; perform sensitivity analysis.
- Present results.
Meta-analysis can be limited by publication bias of the RCTs or other primary studies used, biased selection of available relevant studies, poor quality of the primary studies, unexplainable heterogeneity (or otherwise insufficient comparability) in the primary studies, and biased interpretation of findings (Borenstein 2009; Nordmann 2012). The results of meta-analyses that are based on sets of RCTs with lower methodological quality have been reported to show greater treatment effects (i.e., greater efficacy of interventions) than those based on sets of RCTs of higher methodological quality (Moher 1998). However, it is not apparent that any individual quality measures are associated with the magnitude of treatment effects in meta-analyses of RCTs (Balk 2002).
Some of the techniques used in the statistical combination of study findings in meta-analysis are: pooling, effect size, variance weighting, Mantel-Haenszel, Peto, DerSimonian and Laird, and confidence profile method. The suitability of any of these techniques for a group of studies depends on the comparability of the circumstances of the individual studies, type of outcome variables used, assumptions about the uniformity of treatment effects, and other factors (Eddy 1992; Laird 1990; Normand 1999). The different techniques of meta-analysis have specific rules about whether or not to include certain types of studies and how to combine their results. Some meta-analytic techniques adjust the results of the individual studies to try to account for differences in study design and related biases to their internal and external validity. Special computational tools may be required to make the appropriate adjustments for the various types of biases in a systematic way (Detsky 1992; Moher 1999; van Houwelingen 2002).
The shortcomings of meta-analyses, which are shared by—though are generally greater in—unstructured literature reviews and other less rigorous synthesis methods, can be minimized by maintaining a systematic approach. Performing meta-analyses as part of high-quality systematic reviews, i.e., that have objective means of searching the literature and apply predetermined inclusion and exclusion criteria to the primary studies used, can diminish the impact of these shortcomings on the findings of meta-analyses (Egger, Smith, Sterne 2001). Compared to the less rigorous methods of combining evidence, meta-analysis can be time-consuming and requires greater statistical and methodologic skills. However, meta-analysis is a much more explicit and accurate method.
Box IV-2. Meta-Analysis: Clinical Trials of Intravenous Streptokinase for Acute Myocardial Infarction

The conventional meta-analysis at left depicts observed treatment effects (odds ratios) and confidence intervals of the 33 individual studies, most of which involved few patients. Although most trials favored streptokinase, the 95 percent confidence intervals of most trials included odds ratios of 1.0 (indicating no difference between treatment with streptokinase and the control intervention). Several studies favored the control treatment, although all of their confidence intervals included odds ratios of 1.0. As shown at the bottom, this meta-analysis pooled the data from all 33 studies (involving a total of 36,974 patients) and detected an overall treatment effect favoring streptokinase, with a narrow 95 percent confidence interval that fell below the 1.0 odds ratio, and P less than 0.001. (P values less than 0.05 or 0.01 are generally accepted as statistically significant.)
The graph at right depicts a "cumulative" meta-analysis in which a new meta-analysis is performed with the chronological addition of each trial. As early as 1971, when available studies might have appeared to be inconclusive and contradictory, a meta-analysis involving only four trials and 962 patients would have indicated a statistically significant treatment effect favoring streptokinase (note 95% confidence interval and P<0.05). By 1973, after eight trials and 2,432 patients, P would have been less than 0.01. By 1977, the P value would have been less than 0.001, after which the subsequent trials had little or no effect on the results establishing the efficacy of streptokinase in saving lives. This approach indicates that streptokinase could have been shown to be lifesaving two decades ago, long before FDA approval was sought and it was adopted into routine practice.
From Lau J, Antman EM, Jiminez-Silva J, Kupelnick B, Mosteller F, Chalmers TC. Cumulative meta-analysis of therapeutic trials for myocardial infarction. N Engl J Med, 327:248-54. Copyright © (1992) Massachusetts Medical Society. Reprinted with permission from Massachusetts Medical Society.
Box IV-2 shows two types of meta-analysis side-by-side: a conventional meta-analysis and a cumulative meta-analysis of the impact of thrombolytic therapy (to dissolve blood clots) on mortality among patients with myocardial infarction. These meta-analyses are applied to the same set of 33 clinical trials reported over a 30-year period. Most of these trials had tens or hundreds of patients, though two were much larger. The “forest plot” diagram on the left represents a single conventional meta-analysis of those 33 trials. Across the sum of nearly 37,000 patients in the 33 trials, that meta-analysis yielded a statistically significant treatment effect favoring the use of streptokinase. The forest plot on the right depicts a cumulative meta-analysis in which iterative meta-analyses could have been performed each time a report of a new trial appeared. The cumulative meta-analysis suggests that a statistically significant treatment effect of streptokinase on morality could have been discerned many years earlier than the appearance of the last of the 33 trials.
Network meta-analysis (also known as multiple-treatment or mixed-treatment comparisons meta-analysis), is used to compare various alternative interventions of interest when there are limited or no available direct (“head-to-head”) trials of those interventions. It enables integration of data from available direct trials and from indirect comparisons, i.e., when the alternative interventions are compared based on trials of how effective they are versus a common comparator intervention (Caldwell 2005; Jansen 2011).
Although meta-analysis has been applied primarily for treatments, meta-analytic techniques also are applied to diagnostic technologies. As in other applications of meta-analysis, the usefulness of these techniques for diagnostic test accuracy is subject to publication bias and the quality of primary studies of diagnostic test accuracy (Deeks 2001; Hasselblad 1995; Irwig 1994; Littenberg 1993). Although meta-analysis is often applied to RCTs, it may be used for observational studies as well (Stroup 2000).
More advanced meta-analytic techniques can be applied to assessing health technologies, e.g., involving multivariate treatment effects, meta-regression, and Bayesian methods (see, e.g., van Houwelingen 2002). Meta-regression refers to techniques for relating the magnitude of an effect to one or more characteristics of the studies used in a meta-analysis, such as patient characteristics, drug dose, duration of study, and year of publication (Thompson 2002).
Various computer software packages are available to help conduct meta-analyses; examples are Comprehensive Meta-analysis (CMA), OpenMeta[Analyst], and RevMan, though no particular recommendation is offered here.
D. Guidelines for Reporting Primary and Secondary Research
The conduct of systematic reviews, meta-analysis, and related integrative studies requires systematic examination of the reports of primary data studies as well as other integrative methods. As integrative methods have taken on more central roles in HTA and other forms of evaluation, methodological standards for conducting and reporting these studies have risen (Egger, Smith, Altman 2001; Moher 1999; Petitti 2001; Stroup 2000). In addition to the PRISMA instrument for systematic reviews and meta-analyses noted above, there are other instruments for assessing the reporting of clinical trials, systematic reviews, meta-analyses of trials, meta-analyses of observational studies, and economic analyses. Some of these are listed in Box IV-3. HTA programs that use the inclusion/exclusion rules and other aspects of these instruments are more likely to conduct more thorough and credible assessments. In addition to their primary purpose of improving reporting of research, these guidelines are helpful forplanning studies of these types and in reviewing studies as part of systematic reviews and other integrative methods. See also Research Reporting Guidelines and Initiatives compiled by the US NLM at: //www.nlm.nih.gov/services/research_report_guide.html.
Box IV-3. Guidelines for Reporting Research
- AMSTAR (Assessment of Multiple Systematic Reviews) (Shea 2009)
- CHEERS (Consolidated Health Economic Evaluation Reporting Standards) (Husereau 2013)
- CONSORT (Consolidated Standards of Reporting Trials) (Turner 2012)
- GRACE (Good ReseArch for Comparative Effectiveness) (Dreyer 2014)
- MOOSE (Meta-analysis of Observational Studies in Epidemiology) (Stroup 2000)
- PRISMA (Preferred Reporting Items for Systematic Reviews and Meta-Analyses) (Moher 2009)
- QUOROM (Quality Of Reporting Of Meta-analyses) (Moher 1999)
- STARD (Standards for Reporting of Diagnostic Accuracy) (Bossuyt 2003)
- STROBE (Strengthening the Reporting of OBservational Studies in Epidemiology) (von Elm 2008)
- TREND (Transparent Reporting of Evaluations with Nonrandomized Designs) (Des Jarlais 2004)
E. Modeling
Quantitative modeling is used to evaluate the clinical and economic effects of health care interventions. Models are often used to answer “What if?” questions. That is, they are used to represent (or simulate) health care processes or decisions and their impacts under conditions of uncertainty, such as in the absence of actual data or when it is not possible to collect data on all potential conditions, decisions, and outcomes of interest. For example, decision analytic modeling can be used to represent alternative sequences of clinical decisions for a given health problem and their expected health outcomes and cost effectiveness.
The high cost and long duration of large RCTs and other clinical studies also contribute to the interest in developing alternative methods to collect, integrate, and analyze data to answer questions about the impacts of alternative health care interventions. Indeed, some advanced types of modeling are being used to simulate (and substitute in certain ways for) clinical trials.
By making informed adjustments or projections of existing primary data, modeling can help account for patient conditions, treatment effects, and costs that are not present in primary data. This may include adjusting efficacy findings to estimates of effectiveness, and projecting future costs and outcomes.
Among the main types of techniques used in quantitative modeling are decision analysis; state-transition modeling, including Markov modeling (described below) and Monte Carlo simulation; survival and hazard functions; and fuzzy logic. A Monte Carlo simulation uses sampling from random number sequences to assign estimates to parameters with multiple possible values, e.g., certain patient characteristics (Caro 2002; Gazelle 2003; Siebert 2012). Infectious disease modeling is used to understand the spread, incidence, and prevalence of disease, including modeling those that model the impact health care interventions such as immunizations (Bauch 2010) and insect control (Luz 2011).
Decision analysis uses available quantitative estimates to represent (model or simulate) alternative strategies (e.g., of diagnosis and/or treatment) in terms of the probabilities that certain events and outcomes will occur and the values of the outcomes that would result from each strategy (Pauker 1987; Thornton 1992). As described by Rawlins:
Combining evidence derived from a range of study designs is a feature of decision-analytic modelling as well as in the emerging fields of teleoanalysis and patient preference trials. Decision-analytic modelling is at the heart of health economic analysis. It involves synthesising evidence from sources that include RCTs, observational studies, case registries, public health statistics, preference surveys and (at least in the US) insurance claim databases (Rawlins 2008).
Decision models often are shown in the form of "decision trees" with branching steps and outcomes with their associated probabilities and values. Various software programs may be used in designing and conducting decision analyses, accounting for differing complexity of the strategies, extent of sensitivity analysis, and other quantitative factors.
Decision models can be used in different ways. They can be used to predict the distribution of outcomes for patient populations and associated costs of care. They can be used as a tool to support development of clinical practice guidelines for specific health problems. For individual patients, decision models can be used to relate the likelihood of potential outcomes of alternative clinical strategies (such as a decision to undergo a screening test or to select among alternative therapies) or to identify the clinical strategy that has the greatest utility (preference) for a patient. Decision models are also used to set priorities for HTA (Sassi 2003).
Although decision analyses can take different forms, the basic steps of a typical approach are:
- Develop a model (e.g., a decision tree) that depicts the set of important choices (or decisions) and potential outcomes of these choices. For treatment choices, the outcomes may be health outcomes (health states); for diagnostic choices, the outcomes may be test results (e.g., positive or negative).
- Assign estimates (based on available literature) of the probabilities (or magnitudes) of each potential outcome given its antecedent choices.
- Assign estimates of the value of each outcome to reflect its utility or desirability (e.g., using a HRQL measure or QALYs).
- Calculate the expected value of the outcomes associated with the particular choice(s) leading to those outcomes. This is typically done by multiplying the set of outcome probabilities by the value of each outcome.
- Identify the choice(s) associated with the greatest expected value. Based on the assumptions of the decision model, this is the most desirable choice, as it provides the highest expected value given the probability and value of its outcomes.
- Conduct a sensitivity analysis of the model to determine if plausible variations in the estimates of probabilities of outcomes or utilities change the relative desirability of the choices. (Sensitivity analysis is used because the estimates of key variables in the model may be subject to random variation or based on limited data or simply expert conjecture.)
Box IV-4 shows a decision tree for determining the cost of treatment for alternative drug therapies for a given health problem.
Box IV-4. Decision Analysis Model: Cost per Treatment, DrugEx vs. Drug Why

| Treatment | Path | Cum. Cost |
Cum. Prob. |
Weighted Avg. Cost |
Expected Avg. Cost/Treatment |
|---|---|---|---|---|---|
| DrugEx | 1 | $1,500 | 0.09 | $135.00 | |
| 2 | 6,500 | 0.01 | 65.00 | ||
| 3 | 1,000 | 0.81 | 810.00 | ||
| 4 | 6,000 | 0.09 | 540.00 | ||
| Total | 1.00 | NA | $1,550 |
| Treatment | Path | Cum. Cost |
Cum. Prob. |
Weighted Avg. Cost |
Expected Avg. Cost/Treatment |
|---|---|---|---|---|---|
| DrugWhy | 1 | $2,500 | 0.0475 | $118.75 | |
| 2 | 7,500 | 0.0025 | 18.75 | ||
| 3 | 2,000 | 0.9025 | 1,805.00 | ||
| 4 | 7,000 | 0.0475 | 332.50 | ||
| Total | 1.00 | $2,275 |
This decision analysis model compares the average cost per treatment of two drugs for a given patient population. The cost of the new DrugWhy is twice that of DrugEx, the current standard of care. However, the probability (Pr) that using DrugWhy will be associated with an adverse health event, with its own costs, is half of the probability of that adverse event associated with using DrugEx. Also, the response rate of patients (i.e., the percentage of patients for whom the drug is effective) for DrugWhy is slightly higher than that of DrugEx. For patients in whom either drug fails, there is a substantial cost of treatment with other interventions. The model assumes that: the drugs are equally effective when patients respond to them; the cost of an adverse effect associated with either drug is the same; and the cost of treating a failure of either drug is the same. For each drug, there are four potential paths of treatment and associated costs, accounting for whether or not there is an adverse effect and whether or not patients respond to the drug. The model calculates an average cost per treatment of using each drug.
A limitation of modeling with decision trees is representing recurrent health states (i.e., complications or stages of a chronic disease that may come and go, such as in multiple sclerosis). In those instances, a preferable alternative approach is to use state-transition modeling (Siebert 2012), such as in the form of Markov modeling, that use probabilities of moving from one state of health to another, including remaining in a given state or returning to it after intervening health states.
A Markov model (or chain) is a way to represent and quantify changes from one state of health to another, such as different stages of disease and death. These changes can result from the natural history of a disease or from use of health technologies. These models are especially useful for representing patient or population experience when the health problem of interest involves risks that are continuous over time, when the timing of health states is important, and when some or all these health states may recur. Markov models assume that each patient is always in one of a set of mutually exclusive and exhaustive health states, with a set of allowable (i.e., non-zero) probabilities of moving from one health state to another, including remaining in the same state. These states might include normal, asymptomatic disease, one or more stages of progressive disease, and death. For example, in cardiovascular disease, these might include normal, unstable angina, myocardial infarction, stroke, cardiovascular death, and death from other causes. Patient utilities and costs also can be assigned to each health state or event. In representing recurring health states, time dependence of the probabilities of moving among health states, and patient utility and costs for those health states, Markov models enable modeling the consequences or impacts of health technologies (Sonnenberg 1993). Box IV-5 shows a Markov chain for transitions among disease states for the natural history of cervical cancer.
Box IV-5. Disease States and Allowed Transitions for the Natural History Component of a Markov Model Used in a Decision Analysis of Cervical Cancer Screening
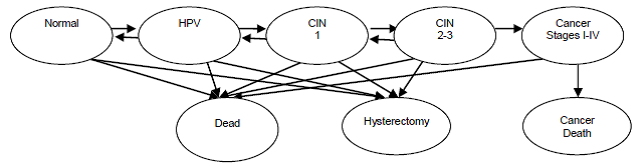
HPV: human papillomavirus; CIN: cervical intraepithelial neoplasia (grades 1, 2, 3)
Transition probabilities among disease states are not shown here.
Source: Kulasingam SL, Havrilesky L, Ghebre R, Myers ER. Screening for Cervical Cancer: A Decision Analysis for the U.S. Preventive Services Task Force. AHRQ Pub. No. 11-05157-EF-1. Rockville, MD: Agency for Healthcare Research and Quality; May 2011.
High-power computing technology, higher mathematics, and large data systems are being used for simulations of clinical trials and other advanced applications. A prominent example is the Archimedes model, a large-scale simulation system that models human physiology, disease, and health care systems. The Archimedes model uses information about anatomy and physiology; data from clinical trials, observational studies, and retrospective studies; and hundreds of equations. In more than 15 diseases and conditions, it models metabolic pathways, onset and progression of diseases, signs and symptoms of disease, health care tests and treatments, health outcomes, health services utilization, and costs. In diabetes, for example, the Archimedes model has been used to predict the risk of developing diabetes in individuals (Stern 2008), determine the cost-effectiveness of alternative screening strategies to detect new cases of diabetes (Kahn 2010), and simulate clinical trials of treatments for diabetes (Eddy 2003).
One of the challenges of decision analysis is accounting for the varying perspectives of stakeholders in a given decision, including what attributes or criteria (e.g., health benefit, avoidance of adverse events, impact on quality of life, patient copayment) are important to each stakeholder and the relative importance or weight of each attribute. Multi-criteria decision analysis (MCDA) has been applied to HTA (Goetghebeur 2012; Thokala 2012). A form of operations research, MCDA is a group of methods for identifying and comparing the attributes of alternatives (e.g., therapeutic options) from the perspectives of multiple stakeholders. It evaluates these alternatives by ranking, rating, or pairwise comparisons, using such stakeholder elicitation techniques as conjoint analysis and analytic hierarchy process.
Models and their results are only aids to decision making; they are not statements of scientific, clinical, or economic fact. The report of any modeling study should carefully explain and document the assumptions, data sources, techniques, and software. Modelers should make clear that the findings of a model are conditional upon these components. The use of decision modeling in cost-effectiveness analysis in particular has advanced in recent years, with development of checklists and standards for these applications (see, e.g., Gold 1996; Philips 2004; Soto 2002; Weinstein 2003).
Assumptions and estimates of variables used in models should be validated against actual data as such data become available, and the models should be modified accordingly. Modeling should incorporate sensitivity analyses to quantify the conditional relationships between model inputs and outputs.
Various computer software packages are available to conduct decision-analytic and other forms of modeling; examples are Decision Analysis, Excel, and TreeAge; no particular recommendation is offered here.
F. Assessing the Quality of a Body of Evidence
Systematic reviews assemble bodies of evidence pertaining to particular evidence questions. Although each body of evidence may comprise studies of one type, e.g., RCTs, they may also comprise studies of multiple designs. Many approaches have been used to assess the quality of a body of evidence since the 1970s. In recent years, there has been some convergence in these approaches, including by such organizations as the Grading of Recommendations Assessment, Development and Evaluation (GRADE) Working Group (Balshem 2011), the Cochrane Collaboration (Higgins 2011), the US Agency for Healthcare Research and Quality Evidence-based Practice Centers (AHRQ EPCs) (Berkman 2014), the Oxford Centre for Evidence-Based Medicine (OCEBM Levels of Evidence Working Group 2011), and the US Preventive Services Task Force (USPSTF) (US Preventive Services Task Force 2008). According to the GRADE Working Group, more than 70 organizations, including international collaborations, HTA agencies, public health agencies, medical professional societies, and others have endorsed GRADE and are using it or modified versions of it (GRADE Working Group 2013).
Increasingly, organizations such as those noted above consider the following types of factors, dimensions, or domains when assessing the quality of a body of evidence:
- Risk of bias
- Precision
- Consistency
- Directness
- Publication (or reporting) bias
- Magnitude of effect size (or treatment effect)
- Presence of confounders that would diminish an observed effect
- Dose-response effect (or gradient)
Risk of bias refers to threats to internal validity, i.e., limitations in the design and implementation of studies that may cause some systematic deviation in an observation from the true nature of an event, such the deviation of an observed treatment effect from the true treatment effect. For a body of evidence, this refers to bias in the overall or cumulative observed treatment effect of the group of relevant studies, for example, as would be derived in a meta-analysis. As described in chapter III regarding the quality of individual studies, the quality of a body of evidence is subject to various types of bias across its individual studies. Among these are selection bias (including lack of allocation concealment), performance bias (including insufficient blinding of patients and investigators), attrition bias, and detection bias. Some quality rating schemes for bodies of evidence compile aggregate ratings of the risk of bias in individual studies.
Precision refers to the extent to which a measurement, such as the mean estimate of a treatment effect, is derived from a set of observations having small variation (i.e., are close in magnitude to each other). Precision is inversely related to random error. Small sample sizes and few observations generally widen the confidence interval around an estimate of an effect, decreasing the precision of that estimate and lowering any rating of the quality of the evidence. Due to potential sources of bias that may increase or decrease the observed magnitude of a treatment effect, a precise estimate is not necessarily an accurate one. As noted in chapter III, some researchers contend that if individual studies are to be assembled into a body of evidence for a systematic review, precision should be evaluated not at the level of individual studies, but when assessing the quality of the body of evidence. This is intended to avoid double-counting limitations in precision from the same source (Viswanathan 2014).
Consistency refers to the extent that the results of studies in a body of evidence are in agreement. Consistency can be assessed based on the direction of an effect, i.e., whether they are on the positive or negative side of no effect or the magnitudes of effect sizes across the studies are similar. One indication of consistency across studies in a body of evidence is overlap of their respective confidence intervals around an effect size. Investigators should seek to explain inconsistency (or heterogeneity) of results. For example, inconsistent results may arise from a body of evidence with studies of different populations or different doses or intensity of a treatment. Plausible explanations of these inconsistent results may include that, in similar patient populations, a larger dose achieves a larger treatment effect; or, given the same dose, a sicker population experiences a larger treatment effect than a less sick population. The quality of a body of evidence may be lower when there are no plausible explanations for inconsistent results.
Directness has multiple meanings in assessing the quality of a body of evidence. First, directness refers to the proximity of comparison in studies, that is, whether the available evidence is based on a “head-to-head” (i.e., direct) comparison of the intervention and comparator of interest, or whether it must rely on some other basis of comparison (i.e., directness of comparisons). For example, where there is no direct evidence pertaining to intervention A vs. comparator B, evidence may be available for intervention A vs. comparator C and of comparator B vs. comparator C; this could provide an indirect basis for the comparison intervention A vs. comparator B. This form of directness can apply for individual studies as well as a body of evidence.
Second, directness refers to how many bodies of evidence are required to link the use of an intervention to the impact on the outcome of interest (i.e., directness of outcomes). For example, in determining whether a screening test has an impact on a health outcome, a single body of evidence (e.g., from a set of similar RCTs) that randomizes patients to the screening test and to no screening and follows both populations through any detection of a condition, treatment decisions, and outcomes would comprise direct evidence. Requiring multiple bodies of evidence to show each of detection of the condition, impact of detection on a treatment decision, impact of treatment on an intermediate outcome, and then impact of the intermediate outcome on the outcome of interest would constitute indirect evidence.
Third, directness can refer to the extent to which the focus or content of an individual study or group of studies diverges from an evidence question of interest. Although evidence questions typically specify most or all of the elements of PICOTS (patient populations, interventions, comparators, outcomes, timing, and setting of care) or similar factors, the potentially relevant available studies may differ in one or more of those respects. As such, directness may be characterized as the extent to which the PICOTS of the studies in a body of evidence align with the PICOTS of the evidence question of interest. This type of directness reflects the external validity of the body of evidence, i.e., how well the available evidence represents, or can be generalized to, the circumstances of interest. Some approaches to quality assessment of a body of evidence address external validity of evidence separately, noting that external validity of a given body of evidence may vary by the user or target audience (Berkman 2014). Some researchers suggest that, if individual studies are to be assembled into a body of evidence for a systematic review, then external validity should be evaluated only once, i.e., when assessing the quality of the body of evidence, not at the level of individual studies (Atkins 2004; Viswanathan 2014).
Publication bias refers to unrepresentative publication of research reports that is not due to the quality of the research but to other characteristics. This includes tendencies of investigators and sponsors to submit, and publishers to accept, reports of studies with “positive” results, such as those that detect beneficial treatment effects of a new intervention, as opposed to those with “negative” results (no treatment effect or high adverse event rates). Studies with positive results also are more likely than those with negative results to be published in English, be cited in other publications, and generate multiple publications (Sterne 2001). When there is reason to believe that the set of published studies is not representative of all relevant studies, there is less confidence that the reported treatment effect for a body of evidence reflects the true treatment effect, thereby diminishing the quality of that body of evidence. Prospective registration of clinical trials (e.g., in ClinicalTrials.gov), adherence to guidelines for reporting research, and efforts to seek out relevant unpublished reports are three approaches used to manage publication bias (Song 2010).
One approach used for detecting possible publication bias in systematic reviews and meta-analyses is to use a funnel plot that graphs the distribution of reported treatment effects from individual studies against the sample sizes of the studies. This approach assumes that the reported treatment effects of larger studies will be closer to the average treatment effect (reflecting greater precision), while the reported treatment effects of smaller studies will be distributed more widely on both sides of the average (reflecting less precision). A funnel plot that is asymmetrical suggests that some studies, such as small ones with negative results, have not been published. However, asymmetry in funnel plots is not a definitive sign of publication bias, as asymmetry may arise from other causes, such as over-estimation of treatment effects in small studies of low methodological quality (Song 2010; Sterne 2011).
The use of the terms, publication bias and reporting bias, varies. For example, in the GRADE framework, reporting bias concerns selective, incomplete, or otherwise differential reporting of findings of individual studies (Balshem 2011). Other guidance on assessing the quality of a body of evidence uses reporting bias as the broader concept, including publication bias as described above and differential reporting of results (Berkman 2014). The Cochrane Collaboration uses reporting bias as the broader term to include not only publication bias, but time lag bias, multiple (duplicate) publication bias, location (i.e., in which journals) bias, citation bias, language bias, and outcome reporting bias (Higgins 2011).
Magnitude of effect size can improve confidence in a body of evidence where the relevant studies report treatment effects that are large, consistent, and precise. Overall treatment effects of this type increase confidence that they did not arise from potentially confounding factors only. For example, the GRADE quality rating approach suggests increasing the quality of evidence by one level when methodologically rigorous observational studies show at least a two-fold change in risk ratio and increasing by two levels for at least a five-fold change in relative risk (Guyatt 2011).
Plausible confounding that would diminish observed effect refers to instances in which plausible confounding factors for which the study design or analysis have not accounted would likely have diminished the observed effect size. That is, the plausible confounding would have pushed the observed effect in the opposite direction of the true effect. As such, the true effect size is probably even larger than the observed effect size. This increases the confidence that there is a true effect. This might arise, for example, in a non-randomized controlled trial (or a comparative observational study) comparing a new treatment to standard care. If, in that instance, the group of patients receiving the new treatment has greater disease severity at baseline than the group of patients receiving standard care, yet the group receiving the new treatment has better outcomes, it is likely that the true treatment effect is even greater than its observed treatment effect.
Dose-response effect (or dose-response gradient) refers to an association in an individual study or across a body of evidence, between the dose, adherence, or duration of an intervention and the observed effect size. That is, within an individual study in which patients received variable doses of (or exposure to) an intervention, the patients that received higher doses also experienced a greater treatment effect. Or, across a set of studies of an intervention in which some studies used higher doses than other studies, those study populations that received higher doses also experienced greater treatment effects. A dose-response effect increases the confidence that an observed treatment effect represents a true treatment effect. Dose-response relationships are typically not linear; further, they may exist only within a certain range of doses.
As is so for assessing the quality of individual studies, the quality of a body of evidence should be graded separately for each main treatment comparison for each major outcome for each where feasible. For example, even for a comparison of one intervention to a standard of care, the quality of the bodies of evidence pertaining to each of mortality, morbidity, various adverse events, and quality of life may differ. For example, the GRADE approach calls for rating the estimate of effect for each critical or otherwise important outcome in a body of evidence. GRADE also specifies that an overall rating of multiple estimates of effect pertains only when recommendations are being made (i.e., not just a quality rating of evidence for individual outcomes) (Guyatt 2013).
Box IV-6. A Summary of the GRADE Approach to Rating Quality of a Body of Evidence
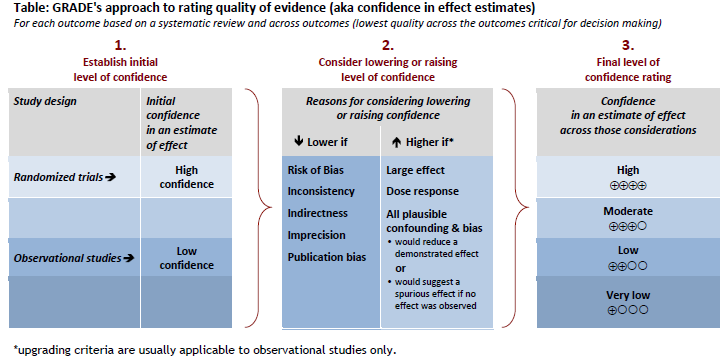
| Quality level | Current definition |
| High | We are very confident that the true effect lies close to that of the estimate of the effect |
| Moderate | We are moderately confident in the effect estimate: The true effect is likely to be close to the estimate of the effect, but there is a possibility that it is substantially different |
| Low | Our confidence in the effect estimate is limited: The true effect may be substantially different from the estimate of the effect |
| Very low | We have very little confidence in the effect estimate: The true effect is likely to be substantially different from the estimate of effect |
Reprinted with permission: GRADE Working Group, 2013. Balshsem H, et al. GRADE guidelines: 3. Rating the quality of evidence. J Clin Epidemiol. 2011(64):401-6.
Among the important ways in which appraisal of evidence quality has evolved from using traditional evidence hierarchies is the accounting for factors other than study design. For example, as shown in the upper portion of Box IV-6, the GRADE approach to rating quality of evidence (which has been adopted by the Cochrane Collaboration and others) starts with a simplified categorization of study types, i.e., RCTs and observational studies, accompanied by two main levels of confidence (high or low) in the estimate of a treatment effect. Then, the rating scheme allows for factors that would raise or lower a level of confidence. Factors that would lower confidence in evidence would include, e.g., risk of bias, inconsistency across the RCTs, indirectness, and publication bias; factors that would increase confidence include, e.g., large effect size and an observed dose-response effect. The final levels of confidence rating (high, moderate, low, very low) are shown at the right, and defined in the lower portion of that box. Similarly, the OCEBM 2011 Levels of Evidence (see chapter III, Box III-13) allows for grading down based on study quality, imprecision, indirectness, or small effect size; and allows for grading up for large effect size. Box IV-7 shows the strength of evidence grades and definitions for the approach used by the AHRQ EPCs, which are based factors that are very similar to those used in GRADE, as noted above.
Box IV-7. Strength of Evidence Grades and Definitions
| Grade | Definition |
| High | We are very confident that the estimate of the effect lies close to the true effect for this outcome. The body of evidence has few or no deficiencies. We believe that the findings are stable, i.e., another study would not change the conclusions. |
| Moderate | We are moderately confident that the estimate of effect lies close to the true effect for this outcome. The body of evidence has some deficiencies. We believe that the findings are likely to be stable, but some doubt remains. |
| Low | We have limited confidence that the estimate of effect lies close to the true effect for this outcome. The body of evidence has major or numerous deficiencies (or both). We believe that additional evidence is needed before concluding either that the findings are stable or that the estimate of effect is close to the true effect. |
| Insufficient | We have no evidence, we are unable to estimate an effect, or we have no confidence in the estimate of effect for this outcome. No evidence is available or the body of evidence has unacceptable deficiencies, precluding reaching a conclusion. |
Source: Berkman ND, et al. Chapter 15. Grading the Strength of a Body of Evidence When Assessing Health Care Interventions for the Effective Health Care Program of the Agency for Healthcare Research and Quality: An Update. In: Methods Guide for Effectiveness and Comparative Effectiveness Reviews. AHRQ Publication No. 10(14)-EHC063-EF. Rockville, MD: Agency for Healthcare Research and Quality. January 2014.
G. Consensus Development
In various forms, group judgment or consensus development is used to set standards, make regulatory recommendations and decisions, make payment recommendations and policies, make technology acquisition decisions, formulate practice guidelines, define the state-of-the-art, and other purposes. The term “consensus development” can refer to particular group processes or techniques that generally are intended to derive best estimates of parameters or general (or unanimous) agreement on a set of findings or recommendations. It also can refer to particular methodological paradigms or approaches, e.g., the consensus development conferences that were conducted by the US NIH.
In contrast to the quantitative synthesis methods of meta-analysis and decision analysis, consensus development is generally qualitative in nature. It may be unstructured and informal, or it may involve formal group methods such as the nominal group technique and Delphi technique (Fink 1984; Gallagher 1993; Jairath 1994). Although these processes typically involve face-to-face interaction, some consensus development efforts combine remote, iterative interaction of panelists (as in the formal Delphi technique) with face-to-face meetings; video and web conferencing and related telecommunications approaches also are used.
In HTA, consensus development is not used as the sole approach to deriving findings or recommendations, but rather as supported by systematic reviews and other analyses and data. Virtually all HTA efforts involve some form of consensus development at some juncture, including one or more of three main steps of HTA: interpret evidence, integrate evidence, and formulate findings and recommendations. Consensus development also can be used for ranking, such as to set assessment priorities, and for rating, such as drawing on available evidence and expert opinion to develop practice guidelines.
The opinion of an expert committee concerning, e.g., the effectiveness of a particular intervention, does not in itself constitute strong evidence. The experience of experts in the forms of, e.g., individual cases or series of cases could comprise poor evidence, as it is subject to multiple forms of bias (selection bias, recall bias, reporting bias, etc.). Where they exist, the results of pertinent, rigorous scientific studies should take precedence. In the absence of strong evidence, and where practical guidance is needed, expert group opinion can be used to infer or extrapolate from the limited available evidence. HTA must be explicit regarding where the evidence stops and where the expert group opinion begins.
Many consensus development programs in the US and around the world were derived from the model of consensus development conference originated at the US NIH in 1977 as part of an effort to improve the translation of NIH biomedical research findings to clinical practice. NIH modified and experimented with its process over the years. Especially in later years, these conferences usually involved a systematic review (such as prepared by an AHRQ Evidence-based Practice Center), in addition to invited expert speaker testimony and public (audience) testimony. The NIH program was discontinued in 2013, after having conducted nearly 130 consensus development conferences and nearly 40 state-of-the-science conferences that used a similar format. Australia, Canada, Denmark, France, Israel, Japan, The Netherlands, Spain, Sweden and the UK are among the countries that used various forms of consensus development programs to evaluate health technologies, some of which were later adapted or incorporated into HTA programs (McGlynn 1990).
Various evaluations and other reports have defined attributes or made recommendations concerning how to strengthen consensus development programs (Goodman 1990; Institute of Medicine 1990; Olsen 1995; Portnoy 2007). Much of this material has contributed to HTA and related fields that use forms of group process.
References for Chapter IV
Atkins D, Best D, Briss PA, Eccles M, et al., GRADE Working Group. Grading quality of evidence and strength of recommendations. BMJ. 2004;328(7454):1490. PubMed| PMC free article
Balk EM, Bonis PAL, Moskowitz H, et al. Correlation of quality measures with estimates of treatment effect in meta-analyses of randomized controlled trials. JAMA. 2002;287(22):2973-82. PubMed
Balshem H, Helfand M, Schünemann HJ, Oxman AD, et al. GRADE guidelines: 3. Rating the quality of evidence. J Clin Epidemiol. 2011;64(4):401-6. PubMed
Bauch CT, Li M, Chapman G, Galvani AP. Adherence to cervical screening in the era of human papillomavirus vaccination: how low is too low? Lancet Infect Dis. 2010;10(2):133-7. PubMed
Bayliss SE, Davenport C. Locating systematic reviews of test accuracy studies: how five specialist review databases measure up. Int J Technol Assess Health Care. 2008;24(4):403-11. PubMed
Berkman ND, Lohr KN, Ansari M, McDonagh M, et al. Chapter 15. Grading the Strength of a Body of Evidence When Assessing Health Care Interventions for the Effective Health Care Program of the Agency for Healthcare Research and Quality: An Update. In: Methods Guide for Effectiveness and Comparative Effectiveness Reviews. AHRQ Publication No. 10(14)-EHC063-EF. Rockville, MD: Agency for Healthcare Research and Quality. January 2014. Accessed Feb. 1, 2014 at: //effectivehealthcare.ahrq.gov/ehc/products/60/318/CER-Methods-Guide-140109.pdf.
Booth A, Clarke M, Dooley G, Ghersi D, et al. PROSPERO at one year: an evaluation of its utility. Syst Rev. 2013;2:4. PubMed | PMC free article
Borenstein M, Hedges LV, Higgins JPT, Rothstein HR. Introduction to Meta-Analysis. Chapter 43: Criticisms of meta-analysis. New York, NY: John Wiley & Sons; 2009.
Bossuyt PM, Reitsma JB, Bruns DE, Gatsonis CA, et al.; Standards for Reporting of Diagnostic Accuracy. Towards complete and accurate reporting of studies of diagnostic accuracy: The STARD Initiative. Ann Intern Med. 2003;138(1):40-4. PubMed
Buckley DI, Ansari M, Butler M, Williams C, Chang C. Chapter 4. The Refinement of Topics for Systematic Reviews: Lessons and Recommendations from the Effective Health Care Program. In: Methods Guide for Effectiveness and Comparative Effectiveness Reviews. AHRQ Publication No. 10(14)-EHC063-EF. Rockville, MD: Agency for Healthcare Research and Quality. January 2014. Accessed Feb. 1, 2014 at: //effectivehealthcare.ahrq.gov/ehc/products/60/318/CER-Methods-Guide-140109.pdf.
Caro JJ, Caro G, Getsios D, et al. The migraine ACE model: evaluating the impact on time lost and medical resource use. Headache. 2002;40(4):282-91. PubMed
Caldwell DM, Ades AE, Higgins JP. Simultaneous comparison of multiple treatments: combining direct and indirect evidence. BMJ. 2005;331(7521):897–900. PubMed | PMC free article
Counsell C. Formulating questions and locating primary studies for inclusion in systematic reviews. Ann Intern Med. 1997;127:380-7. PubMed
Deeks JJ. Systematic reviews in health care: systematic reviews of evaluations of diagnostic and screening tests. BMJ. 2001;323(7305):157-62. PubMed | PMC free article
Des Jarlais DC, Lyles C, Crepaz N; TREND Group. Improving the reporting quality of nonrandomized evaluations of behavioral and public health interventions: the TREND statement. Am J Public Health. 2004;94(3):361-6. PubMed | PMC free article.
Detsky AS, Naylor CD, O'Rourke K, McGeer AJ, L'Abbe KA. Incorporating variations in the quality of individual randomized trials into meta-analysis. J Clin Epid. 1992;45(3):255-65. PubMed
Dreyer NA, Velentgas P, Westrich K, Dubois R. The GRACE Checklist for Rating the Quality of Observational Studies of Comparative Effectiveness: A Tale of Hope and Caution. J Manag Care Pharm. 2014;20(3):301-8. PubMed | Publisher free article
Eckman MH, Levine HJ, Pauker SG. Decision analytic and cost-effectiveness issues concerning anticoagulant prophylaxis in heart disease. Chest. 1992;102(suppl. 4):538-549S. PubMed
Eddy DM. A Manual for Assessing Health Practices & Designing Practice Policies: The Explicit Approach. Philadelphia, Pa: American College of Physicians, 1992.
Eddy DM, Schlessinger L. Validation of the Archimedes diabetes model. Diabetes Care. 2003;26(11):3102-10. PubMed
Egger M, Smith GD, Altman DG, eds. Systematic Reviews in Health Care: Meta-analysis in Context. 2nd ed. London, England: BMJ Books; 2001.
Egger M, Smith GD, Sterne JA. Uses and abuses of meta-analysis. Clin Med. 2001;1(6):478-84. Pubmed
Fink A, Kosecoff J, Chassin M, Brook RH. Consensus methods: characteristics and guidelines for use. Am J Pub Health. 1984;74(9):979-83. PubMed | PMC free article
Gallagher M, Hares T, Spencer J, Bradshaw C, Webb I. The nominal group technique: a research tool for general practice? Family Practice. 1993;10(1):76-81. PubMed
Gazelle GS, Hunink MG, Kuntz KM, et al. Cost-effectiveness of hepatic metastasectomy in patients with metastatic colorectal carcinoma: a state-transition Monte Carlo decision analysis. Ann Surg. 2003;237(4):544-55. PubMed | PMC free article
Goetghebeur MM, Wagner M, Khoury H, et al. Bridging health technology assessment (HTA) and efficient health care decision making with multicriteria decision analysis (MCDA): applying the EVIDEM framework to medicines appraisal. Med Decis Making. 2012;32(2):376-88. PubMed
Gold MR, Siegel JE, Russell LB, Weinstein MC. Cost-Effectiveness in Health and Medicine. New York, NY: Oxford University Press; 1996.
Goodman C, Baratz SR, eds. Improving Consensus Development for Health Technology Assessment: An International Perspective. Washington, DC: National Academy Press; 1990. Accessed Nov. 1, 2013 at: http://www.nap.edu/openbook.php?record_id=1628&page=.
GRADE Working Group. Organizations that have endorsed or that are using GRADE. 2013. Accessed October. 29, 2014 at: http://www.gradeworkinggroup.org/society/index.htm.
Guyatt G, Oxman AD, Sultan S, Brozek J, et al. GRADE guidelines: 11. Making an overall rating of confidence in effect estimates for a single outcome and for all outcomes. J Clin Epidemiol. 2013;66(2):151-7. PubMed
Guyatt GH, Oxman AD, Sultan S, Glasziou P, et al., GRADE Working Group. GRADE guidelines: 9. Rating up the quality of evidence. J Clin Epidemiol. 2011;64(12):1311-6. PubMed
Hasselblad V, Hedges LV. Meta-analysis of screening and diagnostic tests. Psychol Bull. 1995;117(1): 167-78. PubMed
Hernandez DA, El-Masri MM, Hernandez CA. Choosing and using citation and bibliographic database software (BDS). Diabetes Educ. 2008;34(3):457-74. PubMed
Higgins JPT, Green S, eds. Cochrane Handbook for Systematic Reviews of Interventions. Version 5.1.0 [updated March 2011]. The Cochrane Collaboration, 2011. Accessed Sept. 1, 2013 at: https://training.cochrane.org/handbook.
Husereau D, Drummond M, Petrou S, Carswell C, et al.; CHEERS Task Force. Consolidated Health Economic Evaluation Reporting Standards (CHEERS) statement. Int J Technol Assess Health Care. 2013;29(2):117-22. PubMed
Institute of Medicine. Consensus Development at the NIH: Improving the Program. Washington, DC: National Academy Press; 1990. Accessed Nov. 1, 2013 at: http://www.nap.edu/openbook.php?record_id=1563&page=1.
Irwig L, Tosteson AN, Gatsonis C, Lau J, et al. Guidelines for meta-analyses evaluating diagnostic tests. Ann Intern Med. 1994;120(8):667-76. PubMed
Jairath N, Weinstein J. The Delphi methodology (part two): a useful administrative approach. Can J Nurs Admin. 1994;7(4):7-20. PubMed
Jansen JP, Fleurence R, Devine B, et al. Interpreting indirect treatment comparisons and network meta-analysis for health-care decision making: report of the ISPOR Task Force on Indirect Treatment Comparisons Good Research Practices: part 1. Value Health. 2011;14(4):417-28. PubMed
Kahn R, Alperin P, Eddy D, et al. Age at initiation and frequency of screening to detect type 2 diabetes: a cost-effectiveness analysis. Lancet. 2010;375(9723):1365-74. PubMed
Kulasingam SL, Havrilesky L, Ghebre R, Myers ER. Screening for Cervical Cancer: A Decision Analysis for the U.S. Preventive Services Task Force. AHRQ Pub. No. 11-05157-EF-1. Rockville, MD: Agency for Healthcare Research and Quality; May 2011. Accessed June 18, 2014 at: //www.ncbi.nlm.nih.gov/books/NBK92546.
Laird NM, Mosteller F. Some statistical methods for combining experimental results. Int J Technol Assess Health Care. 1990;6(1):5-30. PubMed
Lau J, Antman EM, Jiminez-Silva J, Kupelnick B, Mosteller F, Chalmers TC. Cumulative meta-analysis of therapeutic trials for myocardial infarction. N Engl J Med. 1992;327(4):248-54. PubMed | Publisher free article
Liberati A, Altman DG, Tetzlaff J, et al. The PRISMA statement for reporting systematic reviews and meta-analyses of studies that evaluate health care interventions: explanation and elaboration. PLoS Med. 2009;6(7):e1000100. PubMed | PMC free article
Littenberg B, Moses LE. Estimating diagnostic accuracy from multiple conflicting reports: a new meta-analytic method. Med Dec Making. 1993;13(4):313-21. PubMed
Luz PM, Vanni T, Medlock J, Paltiel AD, Galvani AP. Dengue vector control strategies in an urban setting: an economic modelling assessment. Lancet. 2011;377(9778):1673-80. PubMed | PMC free article
Lyles CM, Kay LS, Crepaz N, Herbst JH, et al. Best-evidence interventions: findings from a systematic review of HIV behavioral interventions for US populations at high risk, 2000-2004. Am J Public Health. 2007;97(1):133-43. PubMed | PMC free article.
McGlynn EA, Kosecoff J, Brook RH. Format and conduct of consensus development conferences. Multi-nation comparison. Int J Technol Assess Health Care. 1990;6(3):450-69. PubMed
Moher D, Cook DJ, Eastwood S, Olkin I, et al. Improving the quality of reports of meta-analyses of randomized controlled trials: the QUOROM statement. Quality of reporting of meta-analyses. Lancet. 1999;354(9193):1896-900. PubMed
Moher D, Liberati A, Tetzlaff J, Altman DG, The PRISMA Group. Preferred Reporting Items for Systematic Reviews and Meta-Analyses: The PRISMA Statement. PLoS Med. 2009;6(7): e1000097. PubMed | PMC free article.
Moher D, Pham B, Jones A, et al. Does quality of reports of randomised trials affect estimates of intervention efficacy reported in meta-analyses? Lancet. 1998;352(9128):609-13. PubMed
Nordmann AJ, Kasenda B, Briel M. Meta-analyses: what they can and cannot do. Swiss Med Wkly. 2012;142:w13518. Publisher free article
Normand SL. Meta-analysis: formulating, evaluating, combining, and reporting. Stat Med. 1999;18:321-59. PubMed
OCEBM Levels of Evidence Working Group. The Oxford 2011 Levels of Evidence. Oxford Centre for Evidence-Based Medicine. Accessed Sept. 1, 2013 at: http://www.cebm.net/index.aspx?o=5653.
Ogilvie D, Egan M, Hamilton V, Petticrew M. Systematic reviews of health effects of social interventions: 2. Best available evidence: how low should you go? J Epidemiol Community Health. 2005;59(10):886-92. PubMed | PMC free article
Olson CM. Consensus statements: applying structure. JAMA. 1995;273(1):72-3. PubMed
Pauker SG, Kassirer, JP. Decision analysis. N Engl J Med. 1987;316(5):250-8. PubMed
Petitti DB. Approaches to heterogeneity in meta-analysis. Stat Med. 2001;20:3625-33. PubMed
Philips Z, Ginnelly L, Sculpher M, Claxton K, et al. Review of guidelines for good practice in decision-analytic modelling in health technology assessment. Health Technol Assess. 2004;8(36):iii-iv, ix-xi, 1-158. PubMed | Publisher free article
Portnoy B, Miller J, Brown-Huamani K, DeVoto E. Impact of the National Institutes of Health Consensus Development Program on stimulating National Institutes of Health-funded research, 1998 to 2001. Int J Technol Assess Health Care, 2007;23(3):343-8. PubMed
Rawlins MD. On the evidence for decisions about the use of therapeutic interventions. The Harveian Oration of 2008. London: Royal College of Physicians, 2008. PubMed
Rew L. The systematic review of literature: synthesizing evidence for practice. J Spec Pediatr Nurs. 2011;16(1):64-9. PubMed
Sassi, F. Setting priorities for the evaluation of health interventions: when theory does not meet practice. Health Policy. 2003;63(2):141-54. PubMed
Savoie I, Helmer D, Green CJ, Kazanjian A. Beyond Medline: reducing bias through extended systematic review search. Int J Technol Assess Health Care. 2003;19(1):168-78. PubMed
Shea BJ, Grimshaw JM, Wells GA, et al. Development of AMSTAR: a measurement tool to assess the methodological quality of systematic reviews. BMC Med Res Methodol.2007;7:10. PubMed | PMC free article.
Shea BJ, Hamel C, Wells GA, Bouter LM, et al. AMSTAR is a reliable and valid measurement tool to assess the methodological quality of systematic reviews. J Clin Epidemiol. 2009;62(10):1013-20. PubMed
Siebert U, Alagoz O, Bayoumi AM, Jahn B, et al.; ISPOR-SMDM Modeling Good Research Practices Task Force. State-transition modeling: a report of the ISPOR-SMDM Modeling Good Research Practices Task Force--3. Value Health. 2012;15(6):812-20. Accessed Feb. 1, 2014 at: //mdm.sagepub.com/content/32/5/690.full.pdf+html. PubMed
Slavin RE. Best evidence synthesis: an intelligent alternative to meta-analysis. J Clin Epidemiol. 1995;48(1):9-18. PubMed
Song F, Parekh S, Hooper L, Loke YK, et al. Dissemination and publication of research findings: an updated review of related biases. Health Technol Assess. 2010;14(8):iii, ix-xi, 1-193. PubMed
Sonnenberg FA, Beck JR. Markov models in medical decision making: a practical guide. Med Decis Making. 1993;13(4):322-38. PubMed
Soto J. Health economic evaluations using decision analytic modeling. Principles and practices--utilization of a checklist to their development and appraisal. Int J Technol Assess Health Care. 2002;18(1):94-111. PubMed
Stern M, Williams K, Eddy D, Kahn R. Validation of prediction of diabetes by the Archimedes model and comparison with other predicting models. Diabetes Care. 2008;31(8):1670-1. PubMed | PMC free article.
Sterne JA, Egger M, Smith GD. Systematic reviews in health care: Investigating and dealing with publication and other biases in meta-analysis. BMJ. 2001;323(7304):101-5. PubMed | PMC free article
Sterne JA, Sutton AJ, Ioannidis JP, Terrin N, et al. Recommendations for examining and interpreting funnel plot asymmetry in meta-analyses of randomized controlled trials. BMJ. 2011;343:d4002. PubMed
Stroup DF, Berlin JA, Morton SC, et al. Meta-analysis of observational studies in epidemiology. A proposal for reporting.Meta-analysis Of Observational Studies in Epidemiology (MOOSE) group. JAMA. 2000;283:2008-12. PubMed
Sutton AJ, Abrams KR, Jones DR, Sheldon TA, Song F. Systematic reviews of trials and other studies. Health Technol Assess. 1998;2(19):1-276. PubMed | Publisher free article
Thacker SB. Meta-analysis: A quantitative approach to research integration. JAMA. 1988; 259(11):1685-9. PubMed
Thokala P, Duenas A. Multiple criteria decision analysis for health technology assessment. Value Health. 2012;15(8):1172-81. PubMed
Thompson SG, Higgins JP. How should meta-regression analyses be undertaken and interpreted? Stat Med. 2002;21(11):1559-73. PubMed
Thornton JG, Lilford RJ, Johnston N. Decision analysis in medicine. BMJ. 1992;304(6834):1099-103. PubMed | PMC free article .
Turner L, Shamseer L, Altman DG, Weeks L, et al. Consolidated standards of reporting trials (CONSORT) and the completeness of reporting of randomised controlled trials (RCTs) published in medical journals. Cochrane Database Syst Rev. 2012 Nov 14;11:MR000030. PubMed
US Preventive Services Task Force. Procedure Manual. AHRQ Publication No. 08-05118-EF, July 2008. Accessed Aug. 1, 2013 at: http://www.uspreventiveservicestaskforce.org/uspstf08/methods/procmanual.htm.
van Houwelingen HC, Arends LR, Stijnen T. Advanced methods in meta-analysis: multivariate approach and meta-regression. Stat Med. 2002;21(4):589-624. PubMed
Viswanathan M, Ansari MT, Berkman ND, Chang S, et al. Chapter 9. Assessing the risk of bias of individual studies in systematic reviews of health care interventions. In: Methods Guide for Effectiveness and Comparative Effectiveness Reviews. AHRQ Publication No. 10(14)-EHC063-EF. Rockville, MD: Agency for Healthcare Research and Quality. January 2014. Accessed Feb. 1, 2014 at: //www.effectivehealthcare.ahrq.gov/ehc/products/60/318/CER-Methods-Guide-140109.pdf.
von Elm E, Altman DG, Egger M, Pocock SJ, et al.; STROBE Initiative. The Strengthening the Reporting of Observational Studies in Epidemiology (STROBE) statement: guidelines for reporting observational studies. J Clin Epidemiol. 2008;61(4):344-9. PubMed
Weinstein MC, O'Brien B, Hornberger J, et al. Principles of good practice for decision analytic modeling in health-care evaluation: report of the ISPOR Task Force on Good Research Practices − Modeling Studies. Value Health. 2003;6(1):9-17. PubMed
Whiting P, Westwood M, Burke M, Sterne J, Glanville J. Systematic reviews of test accuracy should search a range of databases to identify primary studies. J Clin Epidemiol. 2008;61(4):357-64. PubMed
V. Economic Analysis Methods
This section details various economic analysis methods used in HTA to evaluate costs and benefits of health technologies, helping policymakers make resource allocation decisions.
A. Main Types of Economic Analysis in HTA (Box V-1)
Economic analyses in HTA quantify the financial impact and value of interventions, using different metrics for costs and outcomes.
| Analysis Type | Valuation of Costs | Valuation of Outcomes |
|---|---|---|
| Cost of Illness | $ vs. | None |
| Cost Minimization | $ vs. | Assume same |
| Cost Effectiveness (CEA) | $ ÷ | Natural units |
| • Cost Consequence | $ vs. | Natural units |
| • Cost Utility (CUA) | $ ÷ | Utiles (e.g., QALYs) |
| Cost Benefit (CBA) | $ ÷ or - | $ |
| Budget Impact (BIA) | $ vs. | None or maximize various |
C. Cost-Effectiveness Plane (Box V-7)
The cost-effectiveness plane visualizes a new intervention's cost and effectiveness relative to a standard of care. It helps determine if an intervention is 'dominated' (higher cost, lower effectiveness, thus rejected) or 'dominant' (lower cost, higher effectiveness, thus adopted), guiding further analysis for other quadrants.
+ Cost
REJECT (Dominated)
- Effectiveness
+ Cost
ADOPT? (Higher cost, Higher effectiveness)
+ Effectiveness
- Cost
ADOPT (Dominant or Cost-Saving)
+ Effectiveness
- Cost
REJECT? (Lower cost, Lower effectiveness)
- Effectiveness
D. Cost-Utilities for Alternative Therapies for End-Stage Heart Disease (Box V-8)
This table compares cost-utilities for alternative therapies, demonstrating how QALYs (Quality-Adjusted Life Years) are used to assess value across different interventions and inform resource allocation in HTA.
| Therapy | Life years gained (yr) | Mean utility | QALY gained (yr) | Aggregate cost ($) |
|---|---|---|---|---|
| A. Conventional medical treatment | 0.50 | 0.06 | 0.03 | 28,500 |
| B. Heart transplantation | 11.30 | 0.75 | 8.45 | 298,200 |
| C. Total artificial heart (TAH) | 4.42 | 0.65 | 2.88 | 327,600 |
Cost-Utility Ratios for Therapy Comparisons:
| Comparison | Incremental QALY (yr) | Incremental Cost ($) | Marginal Cost per QALY ($/yr) |
|---|---|---|---|
| Heart transplantation vs. Conventional medical (B – A) | 8.42 | 269,700 | 32,031 |
| Total artificial heart vs. Conventional medical (C – A) | 2.85 | 299,100 | 104,947 |
| Total artificial heart vs. Heart transplantation (C – B) | -5.57 | 29,400 | Dominated |
Cost per QALY for Selected Health Care Technologies (Box V-9)
This "league table" provides examples of the cost per QALY gained for various health care technologies, illustrating the range of investment needed to yield an additional QALY. It highlights how efficiency can be compared across disparate interventions.
| Technology | Cost per QALY (£ 1990) |
|---|---|
| Cholesterol testing and diet therapy (all 40-69 yrs) | 220 |
| Neurosurgery for head injury | 240 |
| General practitioner advice to stop smoking | 270 |
| Neurosurgery for subarachnoid hemorrhage | 490 |
| Antihypertensive therapy to prevent stroke (45-64 yrs) | 940 |
| Pacemaker implantation | 1,100 |
| Hip replacement | 1,180 |
| Valve replacement for aortic stenosis | 1,140 |
| Cholesterol testing and treatment | 1,480 |
| Coronary artery bypass graft surgery (left main disease, severe angina) | 2,090 |
| Kidney transplant | 4,710 |
| Breast cancer screening | 5,780 |
| Heart transplantation | 7,840 |
| Cholesterol testing and treatment (incremental) (all 25-39 yrs) | 14,150 |
| Home hemodialysis | 17,260 |
| Coronary artery bypass graft surgery (one-vessel disease, moderate angina) | 18,830 |
| Continuous ambulatory peritoneal dialysis | 19,870 |
| Hospital hemodialysis | 21,970 |
| Erythropoietin for dialysis anemia (with 10% reduction in mortality) | 54,380 |
| Neurosurgery for malignant intracranial tumors | 107,780 |
| Erythropoietin for dialysis anemia (with no increase in survival) | 126,290 |
VI. Determine Topics
This section addresses how HTA organizations identify potential assessment topics and set priorities, considering factors like burden of disease, cost, and potential for impact.
A. Identify Candidate Topics: Horizon Scanning
Horizon scanning functions continuously track information sources to identify new, emerging, and existing health care interventions. This proactive approach helps anticipate technological changes, new uses, and potential impacts.
Information Sources for New and Emerging Health Care Interventions (Box VI-1)
- Large bibliographic databases (e.g., PubMed, Embase)
- Specialized bibliographic databases (e.g., CINAHL, PsycINFO)
- Databases of ongoing research and results (e.g., ClinicalTrials.gov, HSRProj)
- Priority lists and forthcoming assessments from HTA agencies and vendors
- Trade publications, general news, and health care/medical journals
- Conference abstracts and proceedings
- Technology company web sites and industry association sites
- Market research reports
- Regulatory agency announcements (e.g., FDA approvals)
- Adverse event/alert announcements (e.g., FDA MedWatch)
- Payer policies, notifications (e.g., CMS Updates)
- Reports on variations in practice, utilization, or payment policies
- Special reports on health care trends and futures
B. Setting Assessment Priorities
HTA programs use explicit or informal criteria to prioritize assessment topics given limited resources. These criteria help focus efforts on interventions with the greatest potential impact.
Examples of HTA Selection Criteria (Box VI-2)
- High individual or population burden of morbidity, mortality, or disability
- High unit/individual or aggregate/population cost of a technology or health problem
- Substantial variations in practice
- Unexpected adverse event reports
- Potential for HTA findings to impact practice, patient outcomes, or costs
- Available findings not well disseminated or adopted
- Need to make regulatory or payment decision
- Need to make a health program acquisition or implementation decision
- Recent or anticipated “breakthrough” scientific findings
- Sufficient research findings available to base HTA
- Feasibility given resource constraints (funding, time)
- Public or political demand
- Scientific controversy or great interest among health professionals
VII. Retrieve Evidence
This section details the process of gathering relevant evidence for HTA, emphasizing the importance of searching diverse sources and understanding potential biases.
A. Types of Sources for HTA Evidence
To retrieve comprehensive and unbiased evidence, HTA requires searching multiple, often overlapping, information sources. These include traditional published literature and "grey literature."
Core Sources: Bibliographic and Factual Databases (Box VII-1 & VII-2)
- PubMed (including MEDLINE) & Embase: Citations for life sciences and biomedical journal articles.
- Cochrane Database of Systematic Reviews: Systematic reviews of controlled trials.
- Cochrane Central Register of Controlled Trials: Bibliography of controlled trials, including non-peer-reviewed sources.
- Database of Abstracts of Reviews of Effectiveness (DARE): Structured abstracts of systematic reviews.
- Health Technology Assessment Database: Records of completed and ongoing HTA projects.
- NHS Economic Evaluation Database (NHS EED): Abstracts of economic evaluations.
- ClinicalTrials.gov: Registry of ongoing clinical trials and their results.
- HSRProj: Ongoing health services research projects.
- National Guideline Clearinghouse (NGC): Evidence-based clinical practice guidelines.
- CEA Registry: Database of standardized cost-utility analyses.
- And many more specialized databases for specific health fields or research types.
C. Publication Bias
Publication bias refers to the unrepresentative publication of research reports. Positive studies (finding statistically significant effects) are more likely to be published than negative studies, potentially skewing the available evidence for HTA. This can be managed by prospective trial registration and adherence to reporting guidelines.
VIII. Disseminate Findings and Recommendations
Effective dissemination is crucial for HTA findings to influence policy and practice. This section explores strategies for communicating HTA reports to diverse audiences amidst a competitive information landscape.
Options for Dissemination (Box VIII-1)
Dissemination strategies must consider target groups, media, and implementation techniques to effectively convey HTA findings and recommendations.
Target Groups:
- Clinicians (individuals, professional associations)
- Patients/consumers/general public (individuals, organizations)
- Provider institutions (hospitals, clinics)
- Third-party payers/health plans
- Government policymakers (international, national, state, local)
- News services/professionals
- Researchers, life sciences companies, academic institutions, quality assurance organizations.
Media:
- Printed: journals, newsletters, direct mail, newspapers, posters.
- Electronic: Internet, TV, radio, digital video disks, webinars, podcasts.
- Social: wikis, blogs, social networking (e.g., Facebook, LinkedIn), content communities (e.g., YouTube).
- Word of mouth: in-person interaction, lectures, focus groups.
Implementation Techniques/Strategies:
- Patient/consumer-oriented: mass media campaigns, shared decision procedures, modify insurance coverage.
- Clinician-oriented: conferences, continuing education, academic detailing, practice guidelines, reminder systems.
- Institution-oriented: accreditation, standards, benchmarking, public performance data.
IX. Monitor Impact of HTA
Monitoring the impact of HTA reports is essential to understand their effectiveness in influencing policy and practice, although attributing impact can be complex due to many confounding factors.
B. Factors Influencing Impact (Box IX-1)
The impact of HTA reports is influenced by a variety of factors related to target audiences, the environment, and the characteristics of the HTA itself.
Examples of Factors:
- Target clinician characteristics: Specialty, training, financial incentives, awareness of performance, access to evidence, malpractice concerns.
- Target provider organization characteristics: Type of hospital/clinic, financial status, accreditation, market competition, incentives.
- Target patient characteristics: Insurance status, access to care, health status, health awareness, socioeconomic/demographic factors, social interaction.
- Environmental characteristics: Urban/rural setting, economic status, third-party payment models, laws, political factors.
- Characteristics of HTA findings/recommendations: Engagement of stakeholders, timeliness, reputation of organization, transparency, quality of evidence, perceived appropriateness, dissemination media, resources required to implement.
X. Selected Issues in HTA
This section covers various challenges and evolving aspects of HTA, including barriers to its implementation, patient involvement, and different forms of technology management.
A. Barriers to HTA
Despite the growing importance of HTA, several factors can impede its implementation and influence.
- Technological imperative: Fascination with new technology, expectation that new is better.
- Limited resources for HTA: Insufficient funding for comprehensive assessments.
- Insufficient primary data: Lack of studies, especially local or subgroup data.
- Timing misalignment: HTA findings may be outdated by the time they are released or implemented.
- Prestigious proponents: Influence of powerful advocates for technology, even without strong evidence.
- Marketing: Effective promotion by health technology companies.
- Financial incentives: Fee-for-service payment systems encouraging overuse.
- Political actions: Legislative mandates for coverage overriding evidence-based processes.
- Implementation barriers: Lack of access to reports, complex formats, reluctance to change practice.
J. Some Underused Health Care Technologies (US) (Box X-2)
HTA can identify technologies that are underused despite strong evidence of safety, effectiveness, and cost-effectiveness. This list highlights some examples in the US.
- ACE inhibitors for heart failure
- Ambulation aids
- Antibiotics for gastrointestinal ulcers
- Beta blockers post-MI
- Cholesterol-lowering drugs
- Childhood vaccinations
- Cochlear implants
- Colorectal cancer screening
- Corticosteroid inhalants for asthma
- Depression diagnosis and treatment
- Diabetic retinopathy screening
- Hemoglobin A1c testing in diabetics
- Hepatitis B virus vaccination of infants
- HIV testing and ART
- Hypertension management
- Implantable cardioverter-defibrillators
- Influenza immunization
- Incontinence diagnosis and treatment
- Mammography (50+)
- Oral rehydration therapy
- Organ transplantation
- Pain management
- Pap smears
- Pneumococcal vaccine
- Prenatal care
- Smoking cessation interventions
- Thrombolytic therapy
- Warfarin for atrial fibrillation
F. Emerging Good Practices for Patient Involvement in HTA (Box X-1)
Patient and consumer involvement is increasingly recognized as vital in HTA. Their unique perspectives enhance the relevance and accuracy of assessments. Emerging good practices guide effective patient engagement.
- Ensure accessible, transparent, fair, documented, and accountable HTA processes.
- Gain commitment of HTA organization to patient involvement.
- Establish dedicated staff/units for patient involvement with clear communication.
- Plan adequate budgets and resources for patient involvement.
- Conduct equitable recruitment of patients for HTA boards/committees.
- Provide training and education for patient involvement.
- Ensure equitable rights and responsibilities for patient members.
- Provide adequate notice of meetings and input deadlines.
- Inform patient groups about planned/ongoing HTA reports.
- Communicate in plain, patient-appropriate language.
- Provide financial support for patient participants.
- Ensure a welcoming, non-intimidating context for involvement.
- Make reasonable accommodations for accessibility.
- Provide HTA reports/summaries in plain language and accessible formats.
- Actively disseminate reports to patient groups.
- Seek to involve traditionally difficult-to-reach patient groups.
- Document/report patient involvement and its impact.
- Provide recognition and feedback to patients.
Glossary
This interactive glossary provides definitions for key terms used in Health Technology Assessment, allowing for quick reference and enhanced understanding.
Acknowledgements
This section details the process of gathering relevant evidence for HTA, emphasizing the importance of searching diverse sources and understanding potential biases.
A. Types of Sources for HTA Evidence
To retrieve comprehensive and unbiased evidence, HTA requires searching multiple, often overlapping, information sources. These include traditional published literature and "grey literature."
Core Sources: Bibliographic and Factual Databases (Box VII-1 & VII-2)
- PubMed (including MEDLINE) & Embase: Citations for life sciences and biomedical journal articles.
- Cochrane Database of Systematic Reviews: Systematic reviews of controlled trials.
- Cochrane Central Register of Controlled Trials: Bibliography of controlled trials, including non-peer-reviewed sources.
- Database of Abstracts of Reviews of Effectiveness (DARE): Structured abstracts of systematic reviews.
- Health Technology Assessment Database: Records of completed and ongoing HTA projects.
- NHS Economic Evaluation Database (NHS EED): Abstracts of economic evaluations.
- ClinicalTrials.gov: Registry of ongoing clinical trials and their results.
- HSRProj: Ongoing health services research projects.
- National Guideline Clearinghouse (NGC): Evidence-based clinical practice guidelines.
- CEA Registry: Database of standardized cost-utility analyses.
- And many more specialized databases for specific health fields or research types.
C. Publication Bias
Publication bias refers to the unrepresentative publication of research reports. Positive studies (finding statistically significant effects) are more likely to be published than negative studies, potentially skewing the available evidence for HTA. This can be managed by prospective trial registration and adherence to reporting guidelines.